Michael Senkow
I Build Machines
Redesigning Keyword analysis topic selection
One of the earliest wireframes I have of our first ideas for this process….
Which eventually turned into this final version over the course of various iterations.
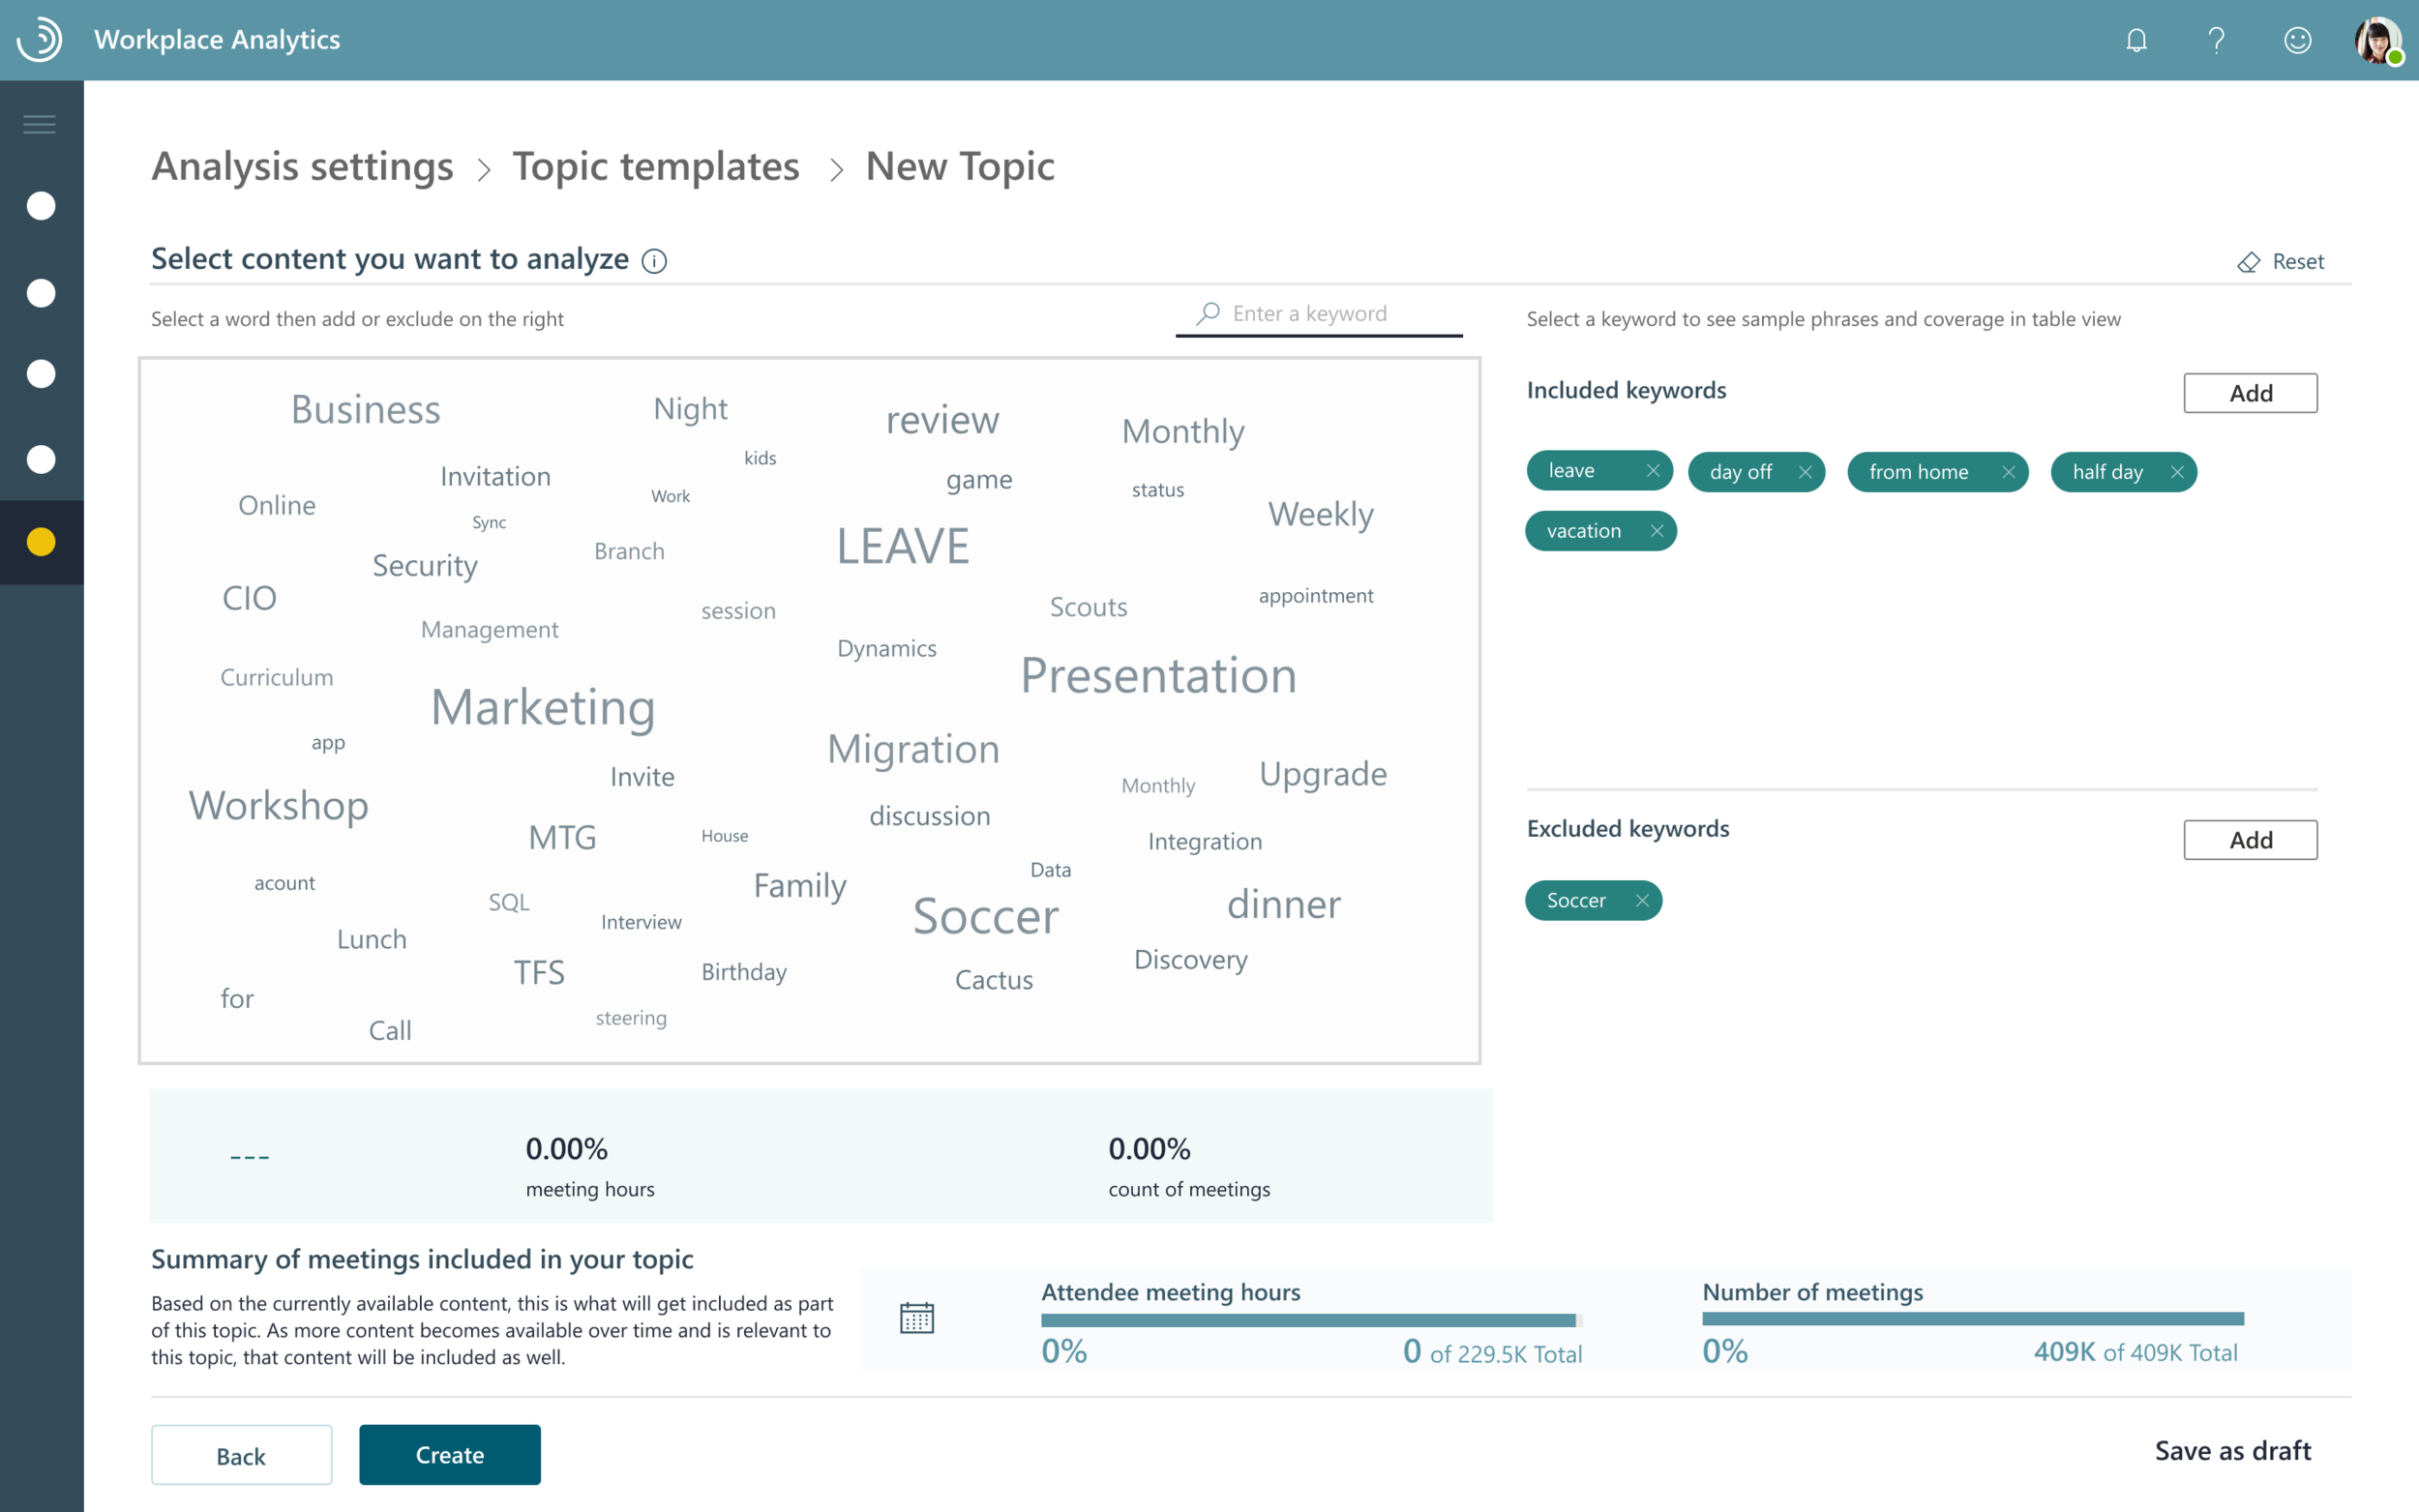
Initial set of designs: Working as the design-lead/consultant for first implementation
During my initial connection to this project, I was working as the design lead for the group. Our primary manager had quit the team leaving me in a role where I was tasked with both IC work and trying to keep the set of four contractors I was working pointed in the right direction until a new Redmond manager was found. Below you can see that preliminary work. My main role was as guidance and consultant:
Making sure we continued to match the existing component system (even if we disagreed on visual styles as this wouldn’t be in scope).
Confirming that the contractor’s work was fitting in with the needs of PM and Engineering
Doing mini-design critiques. Overall the work was a success and was implemented but…
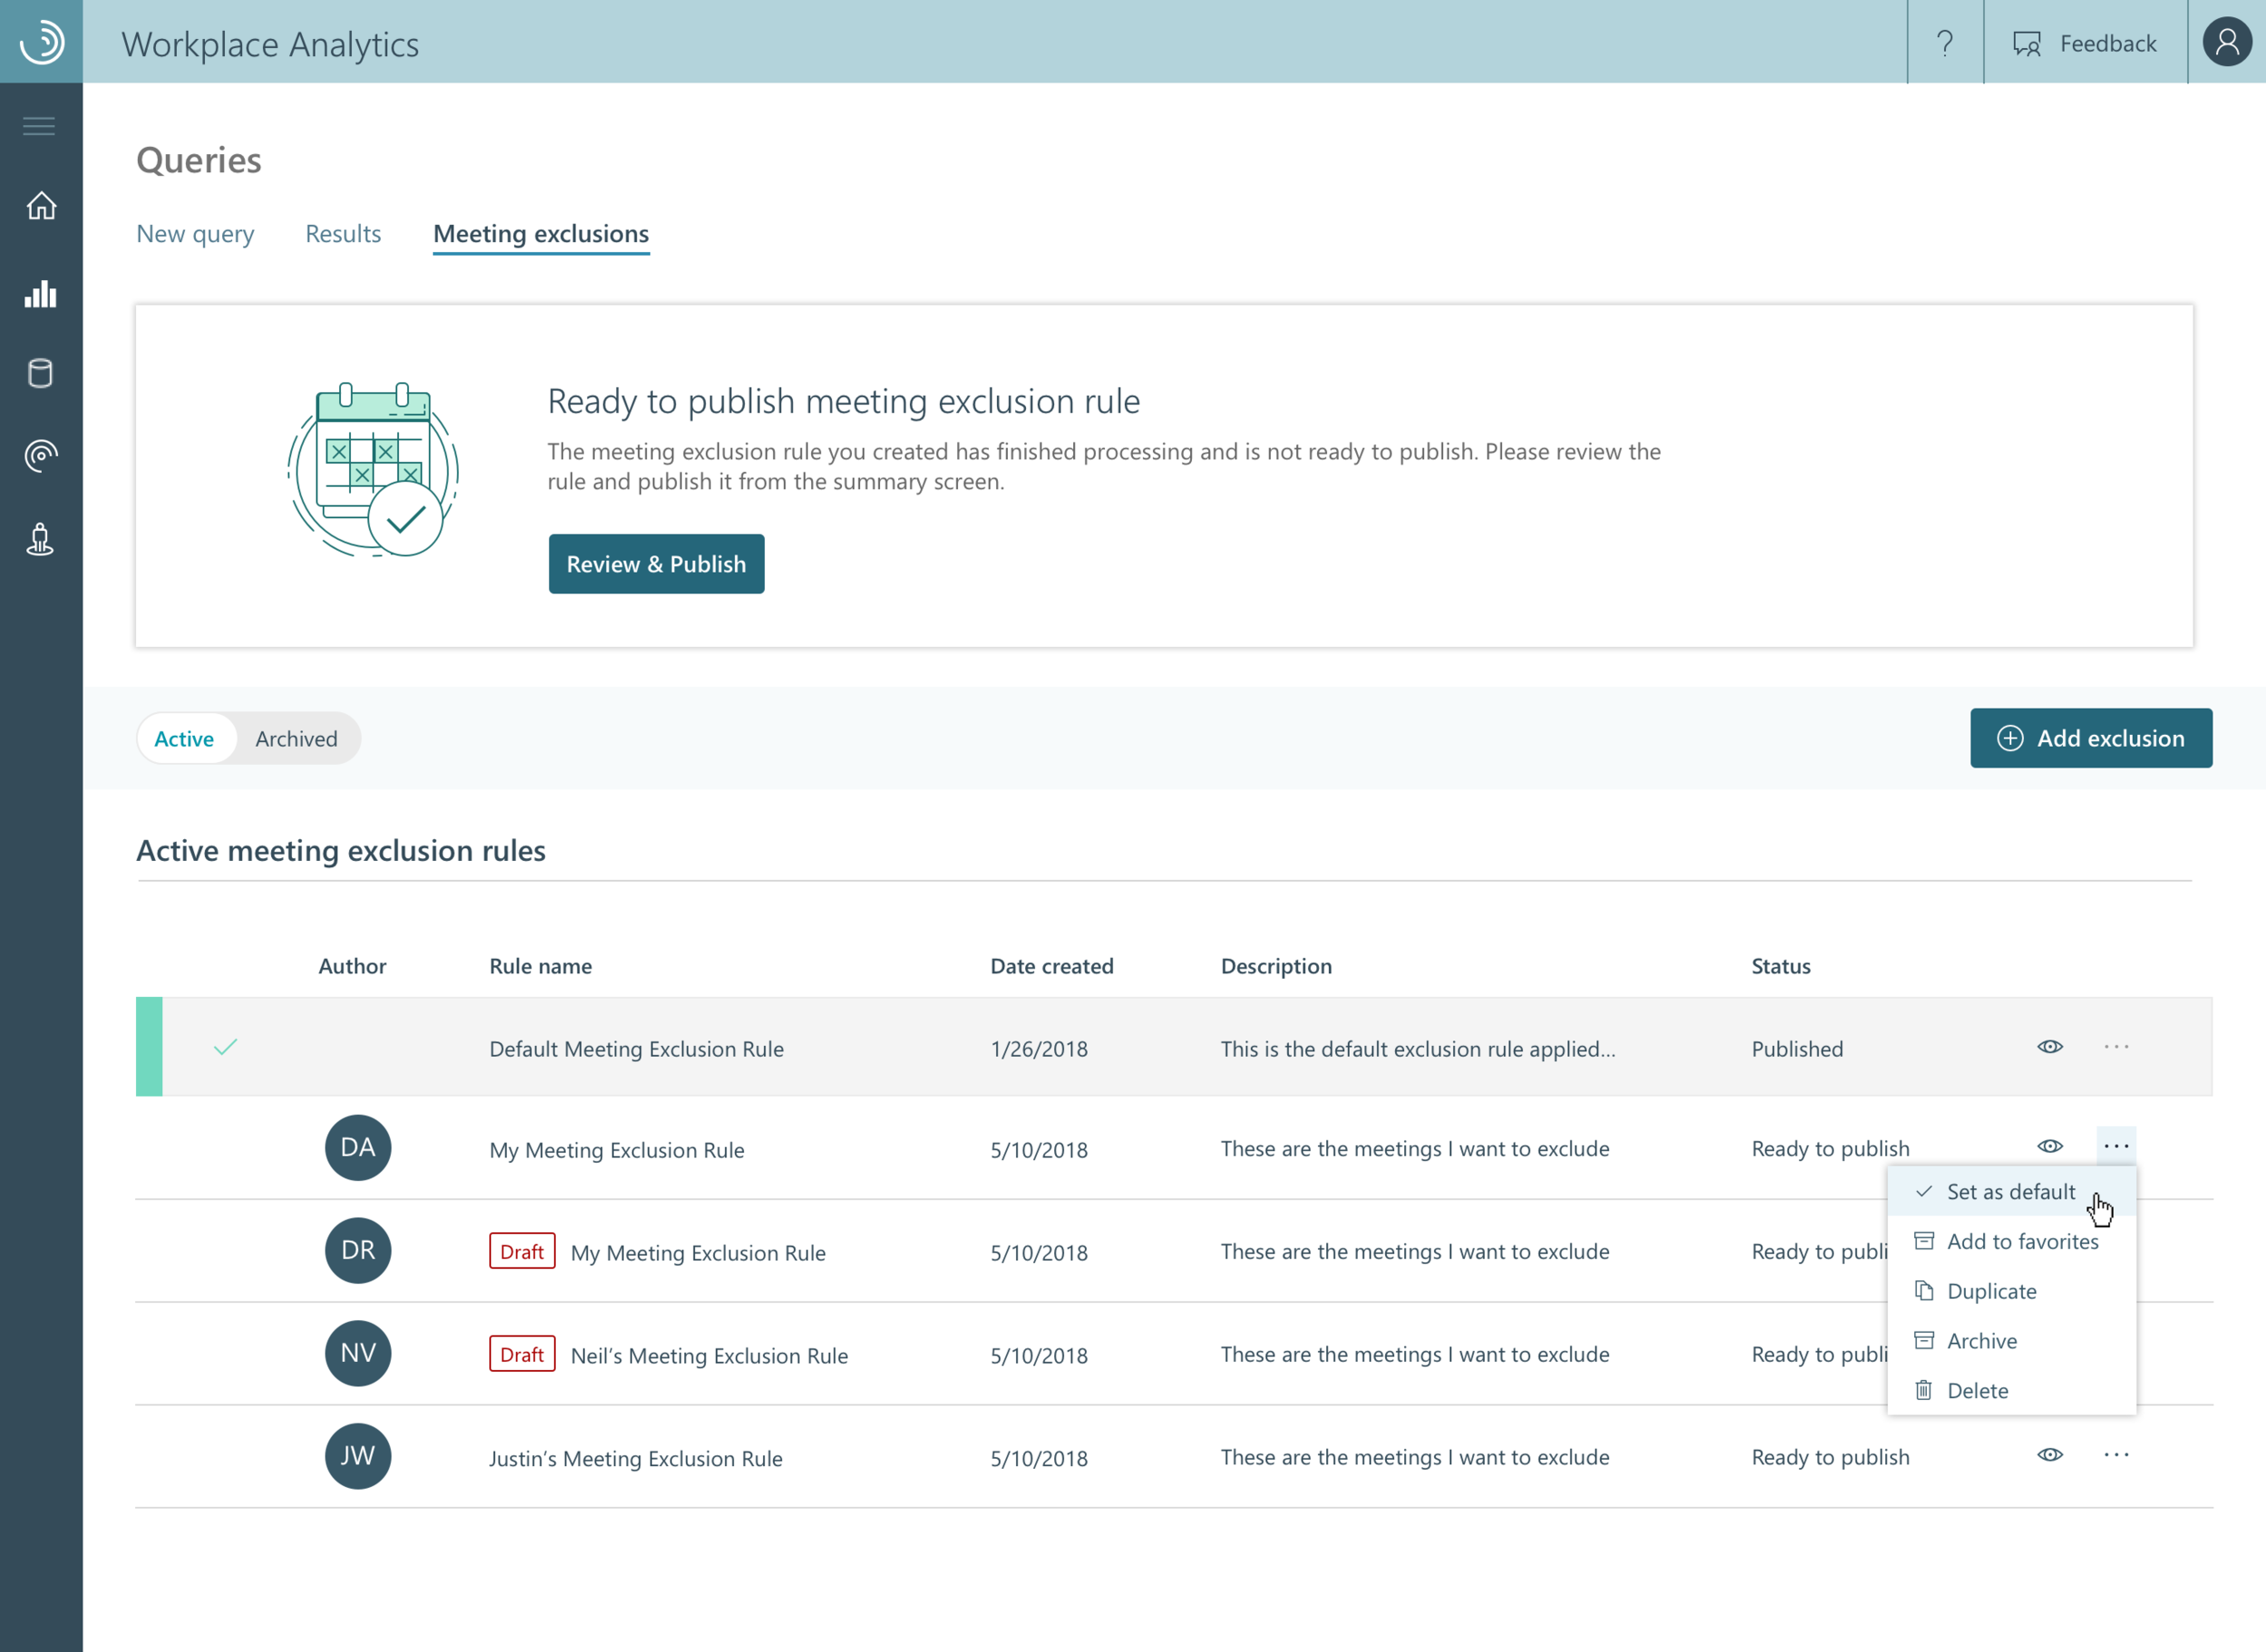
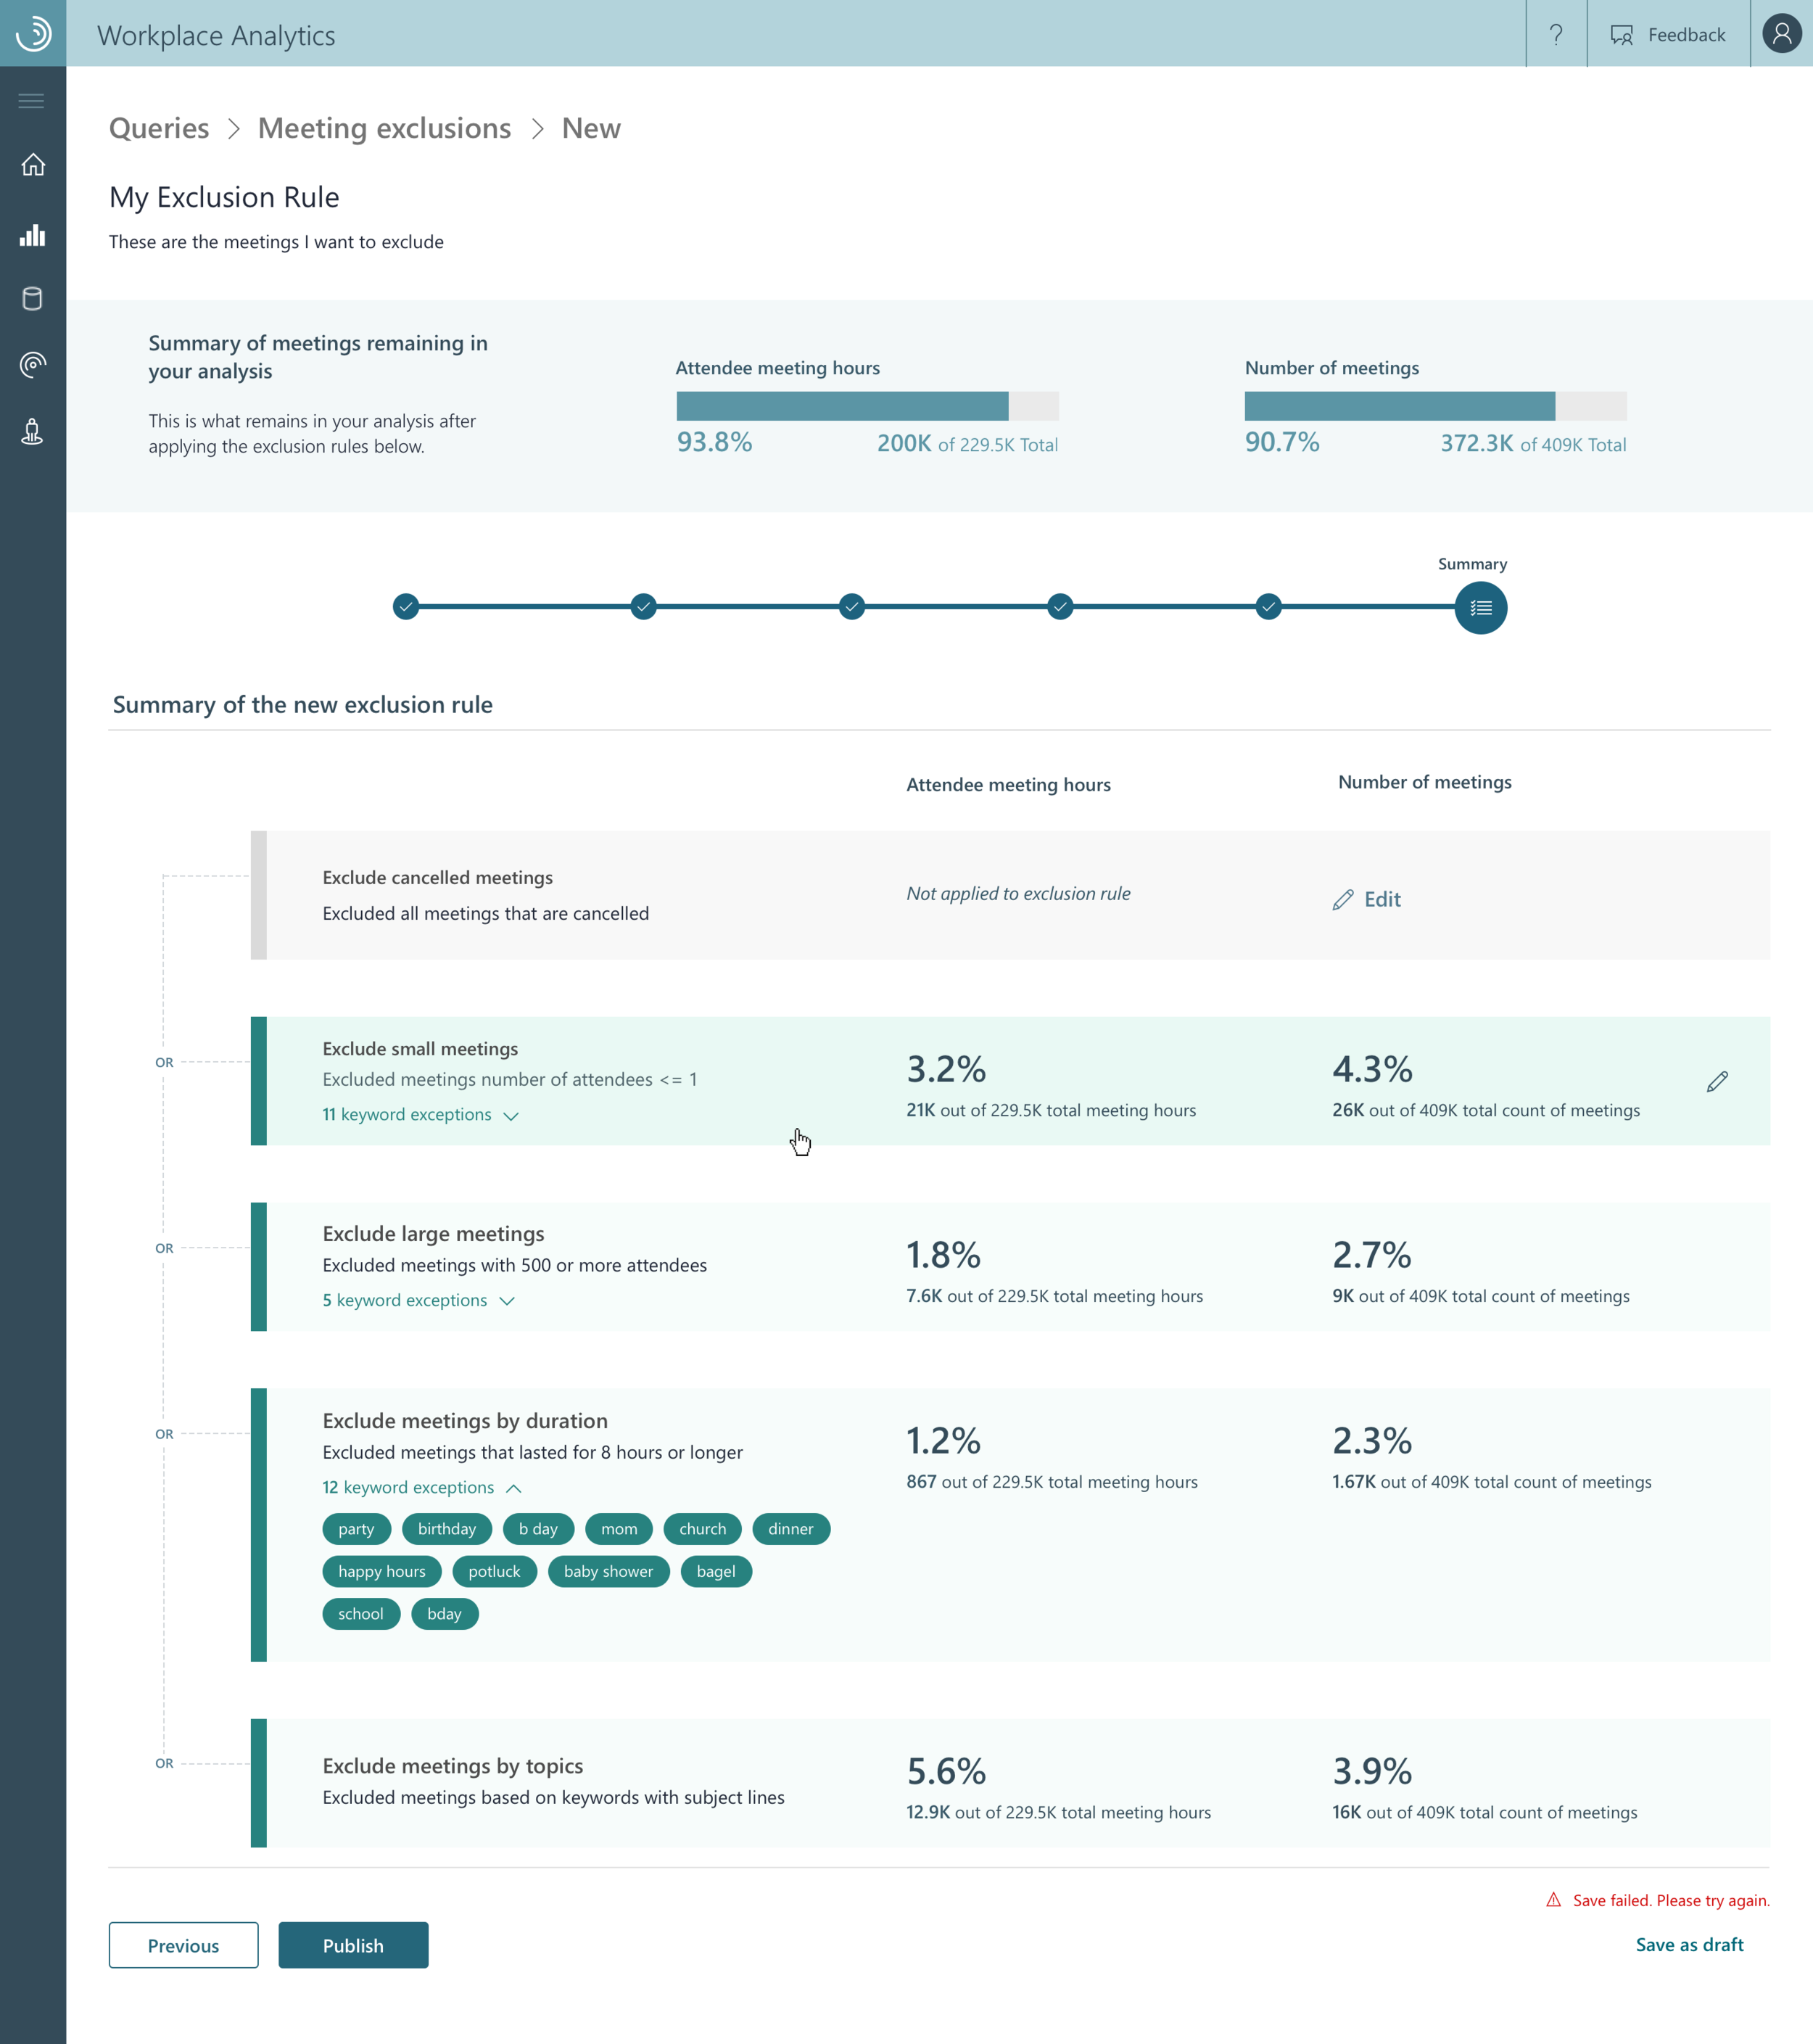

Push for integration of designs into other areas of the Workplace Analytics
Workplace Analytics was a new product at Microsoft so much of the push on the team was simply pushing for the integration of new aspects of the product.
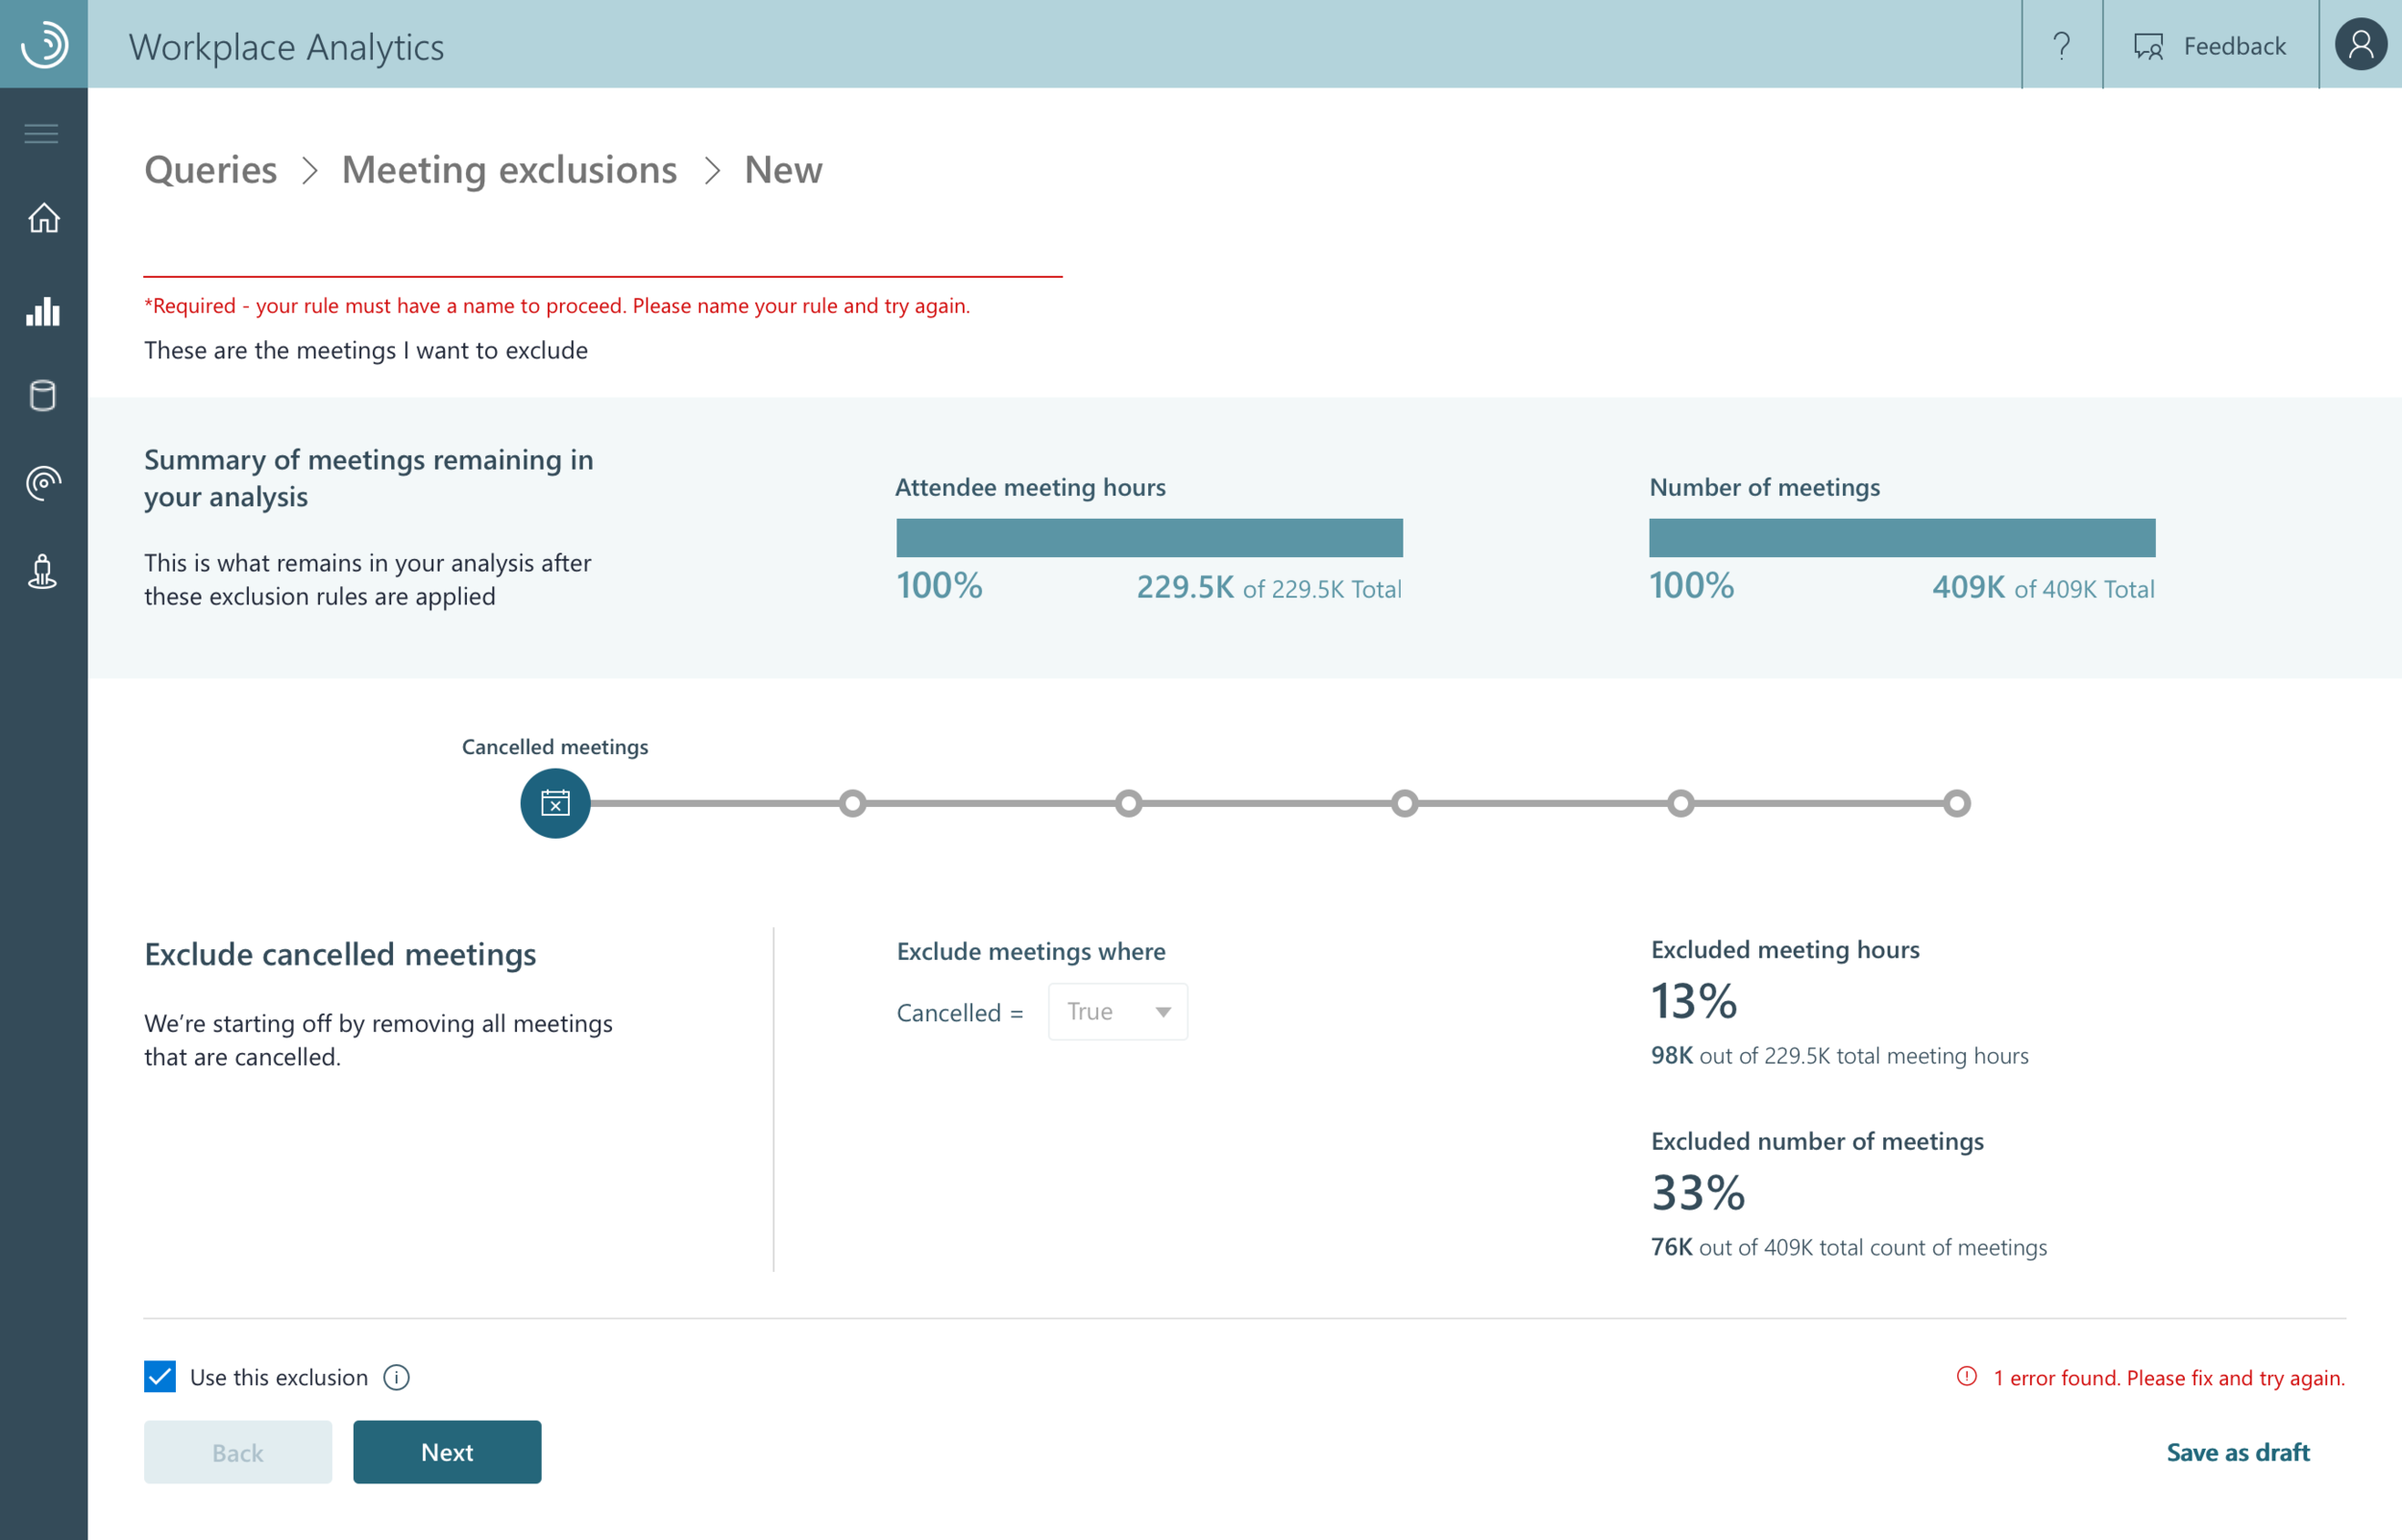
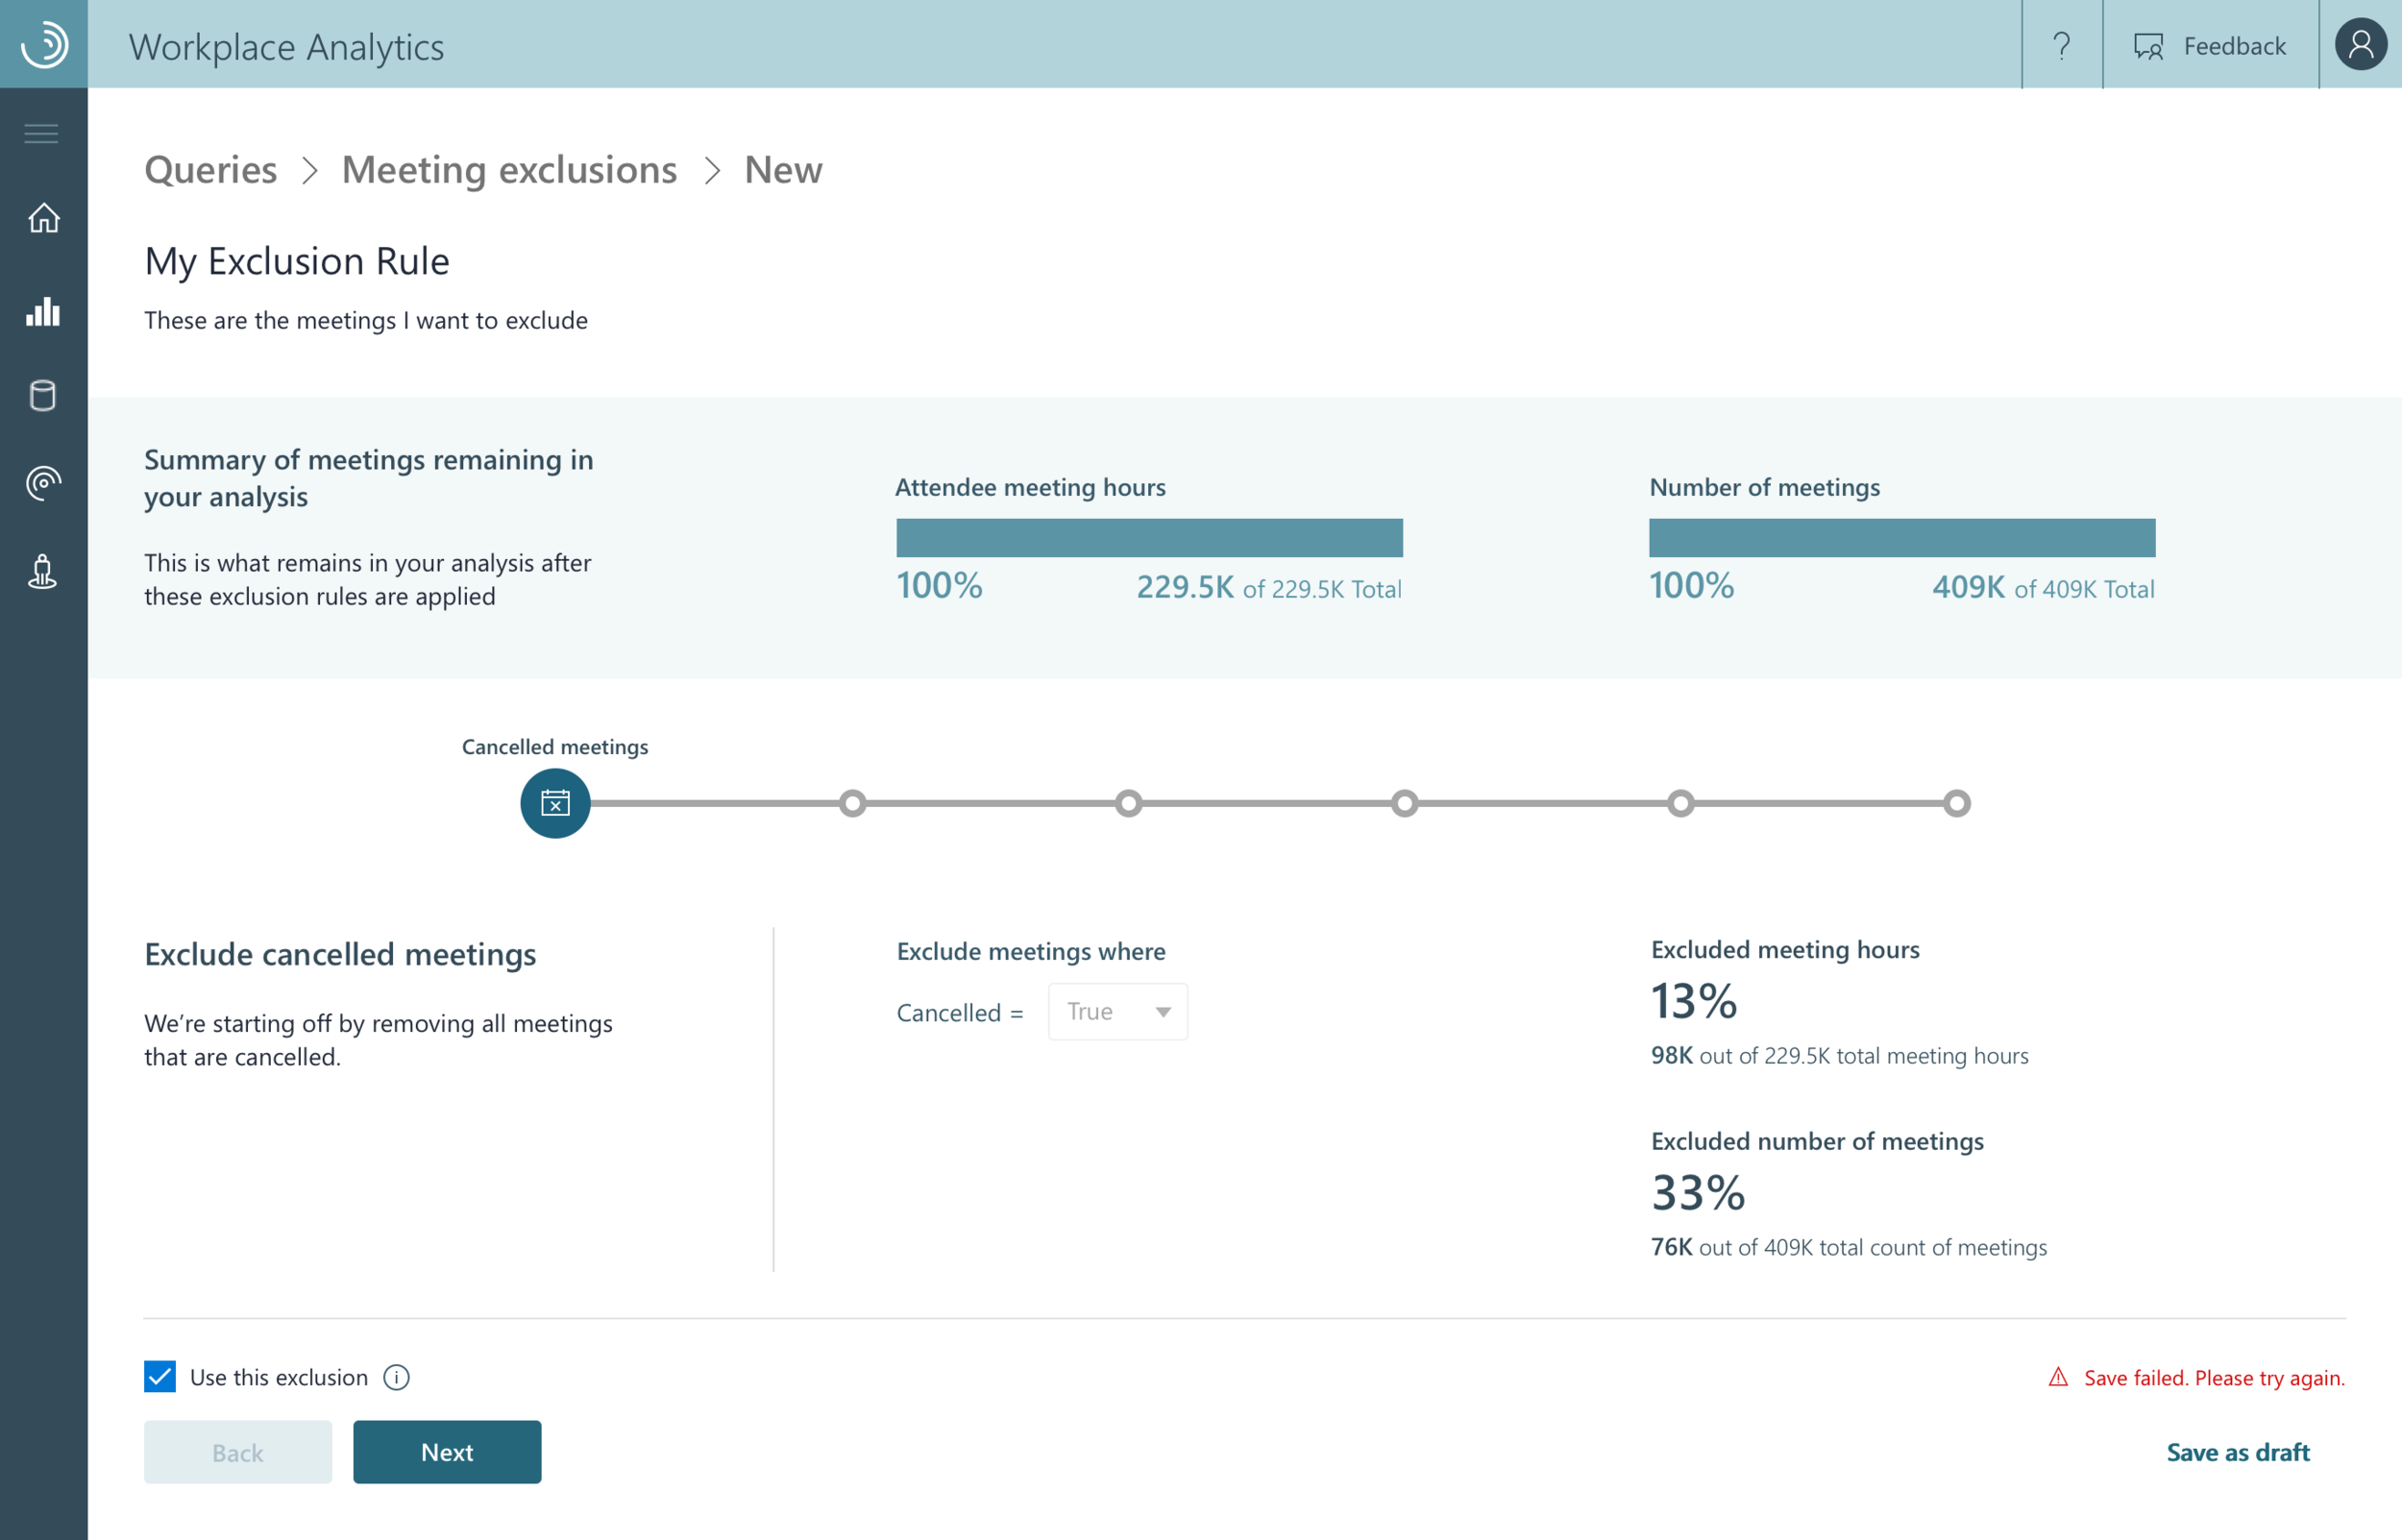
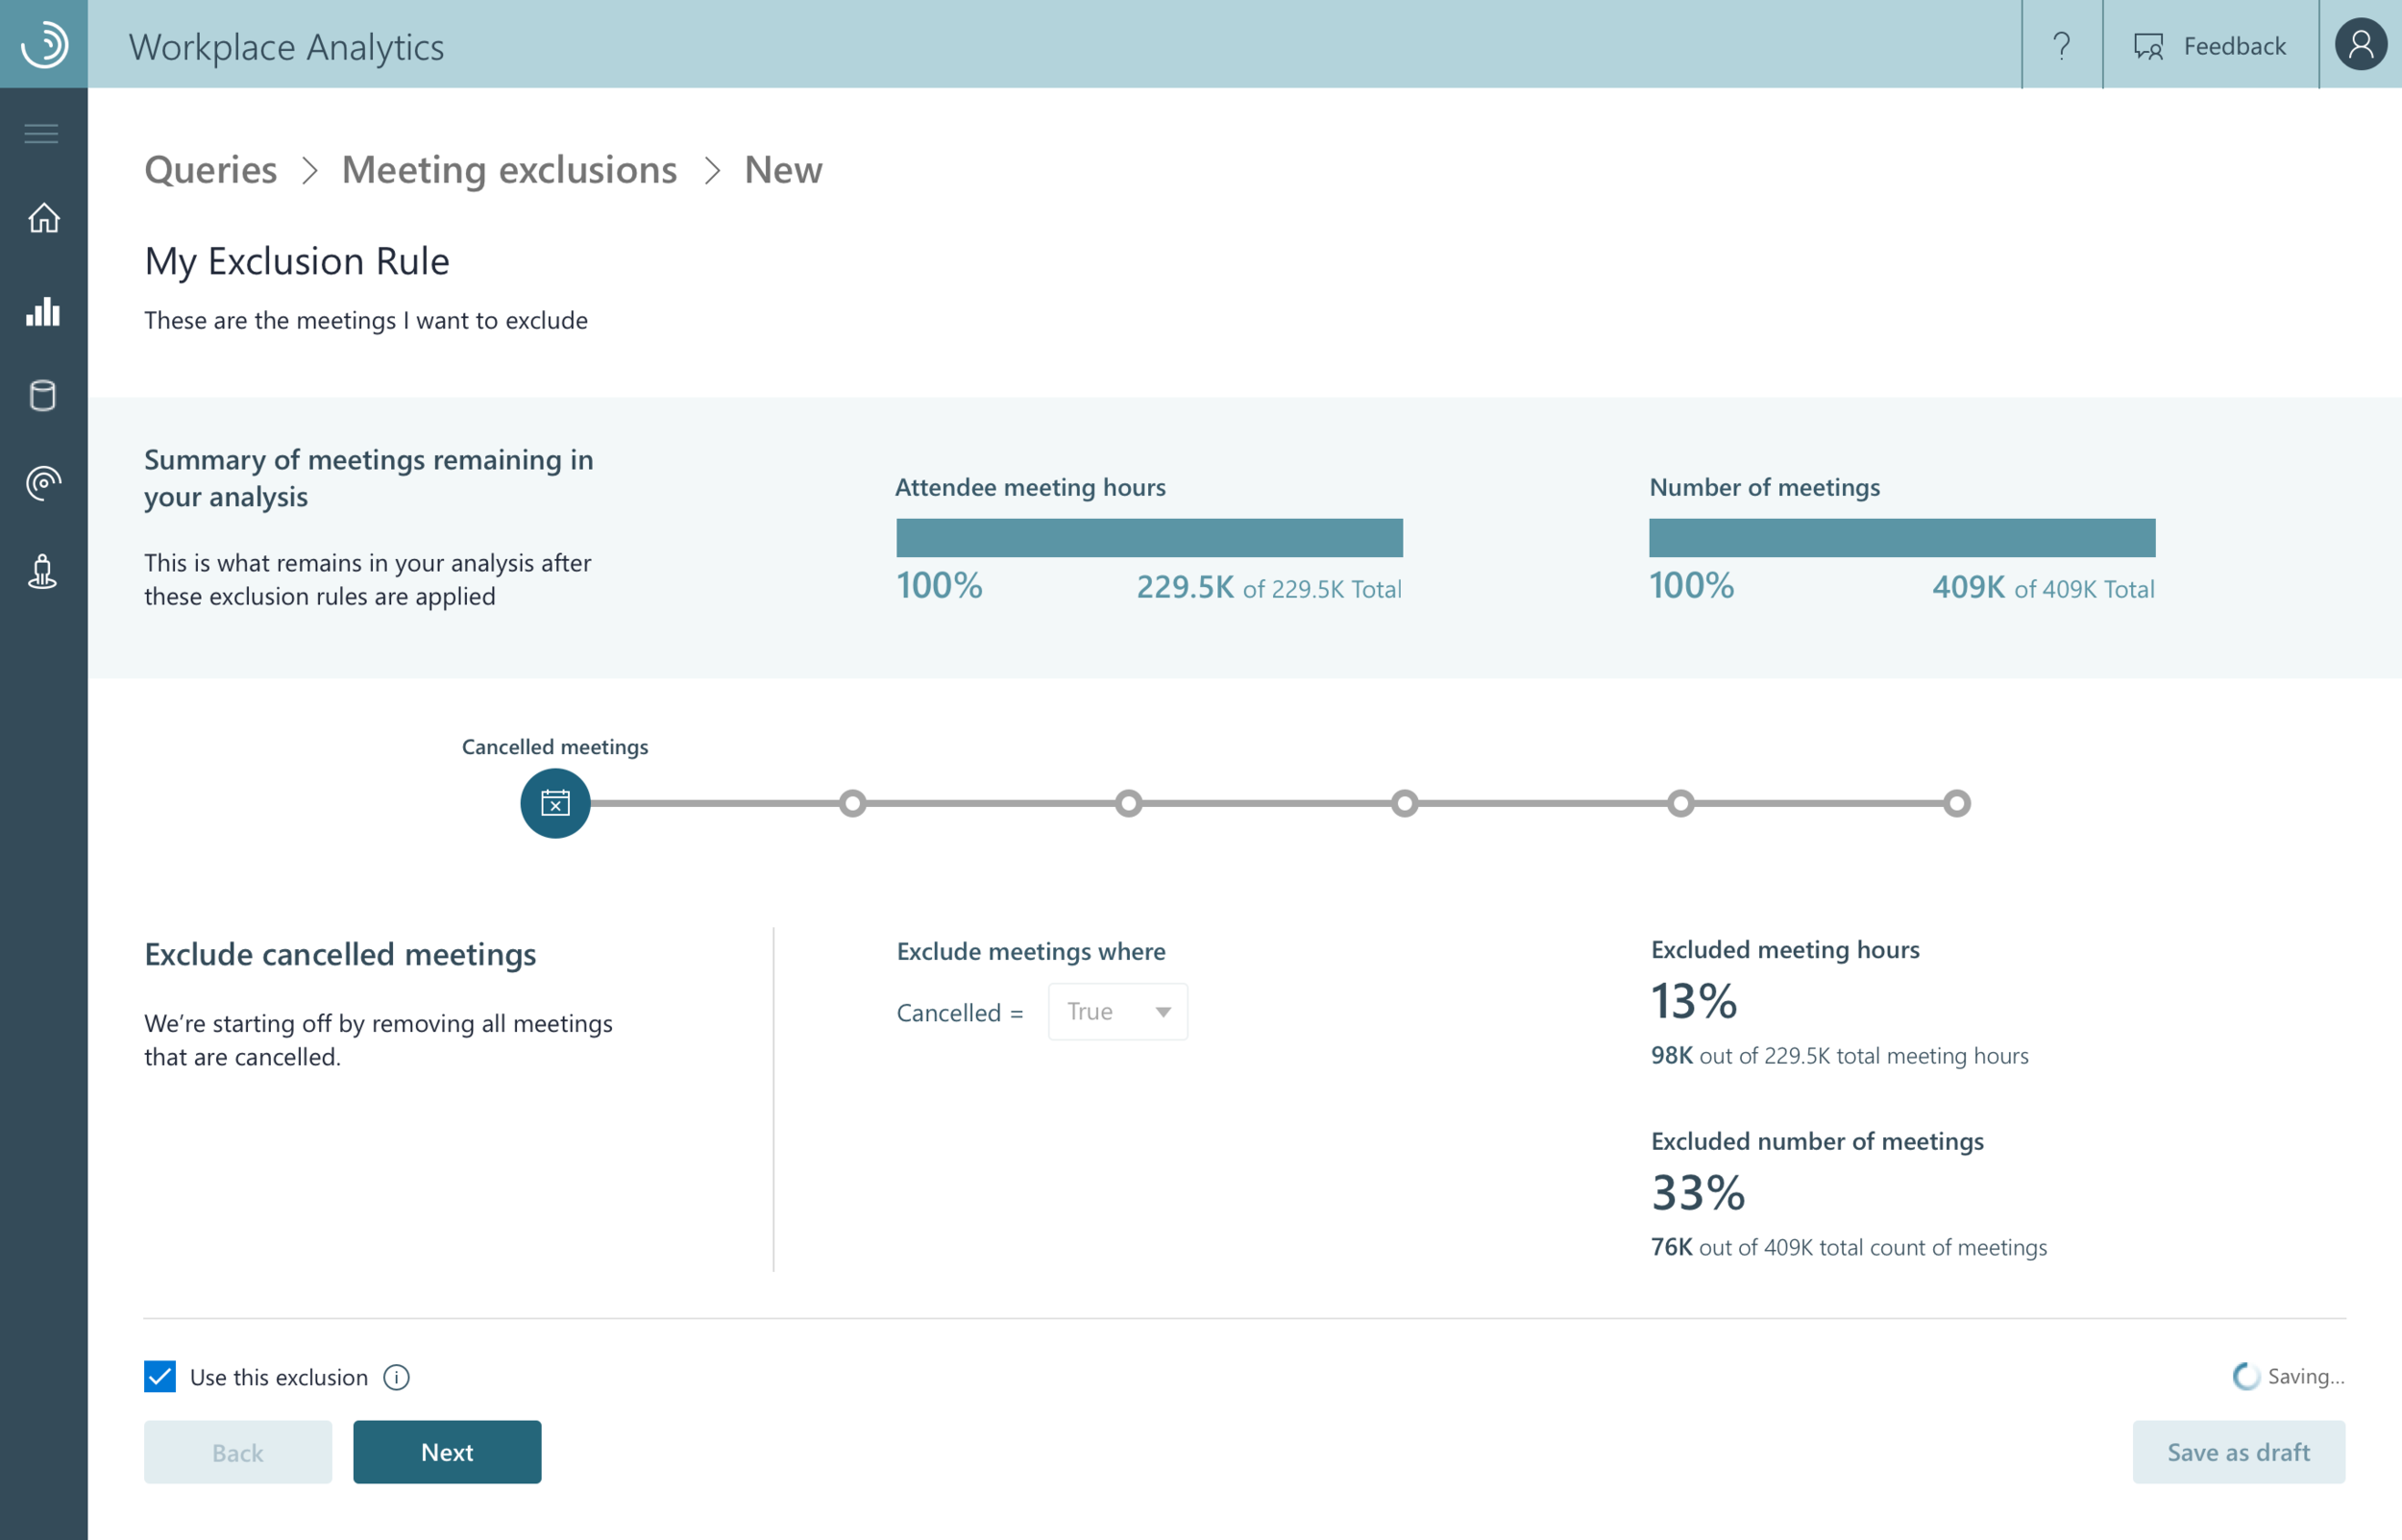
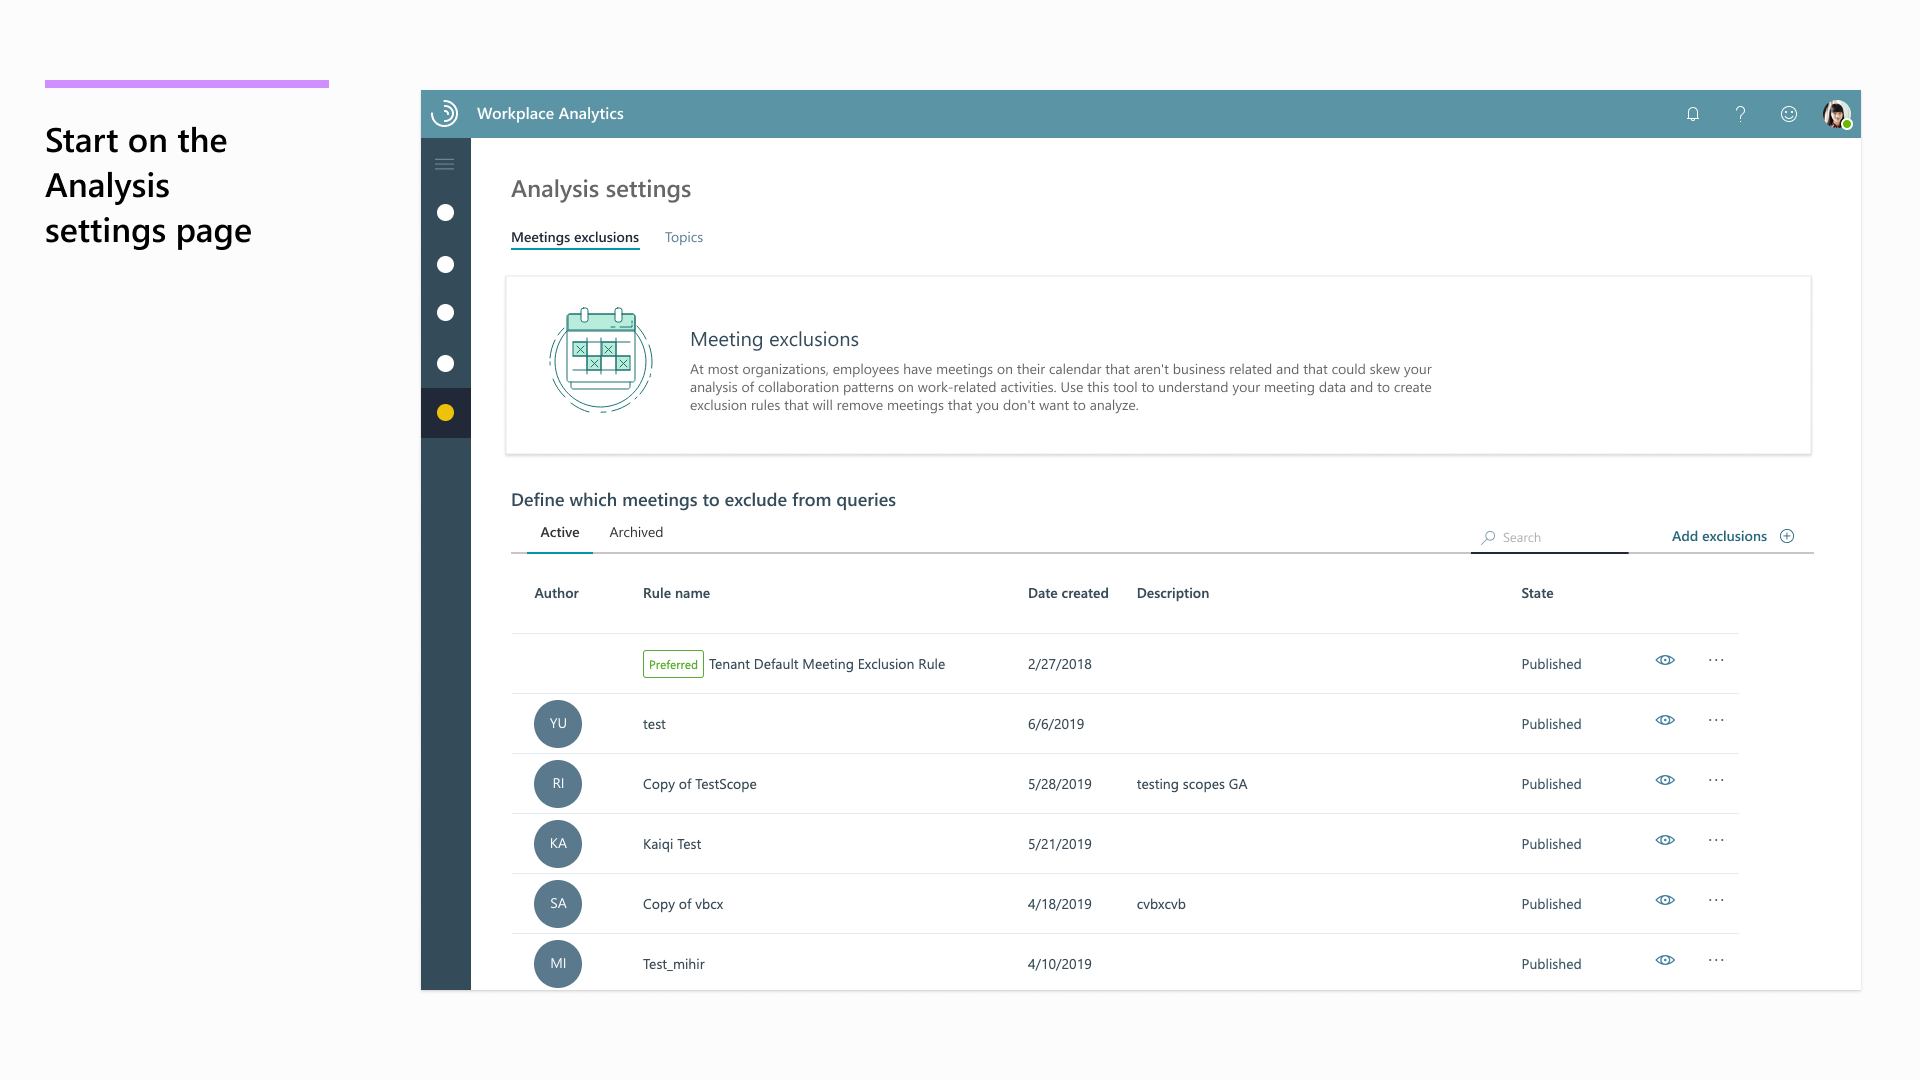
Here for example, I took the preliminary designs laid out our contracting designer, updated them for another section of the application in conjunction with PM and Engineering (here for Meeting exclusion keyword selection for as opposed to Topic selection for analytics.
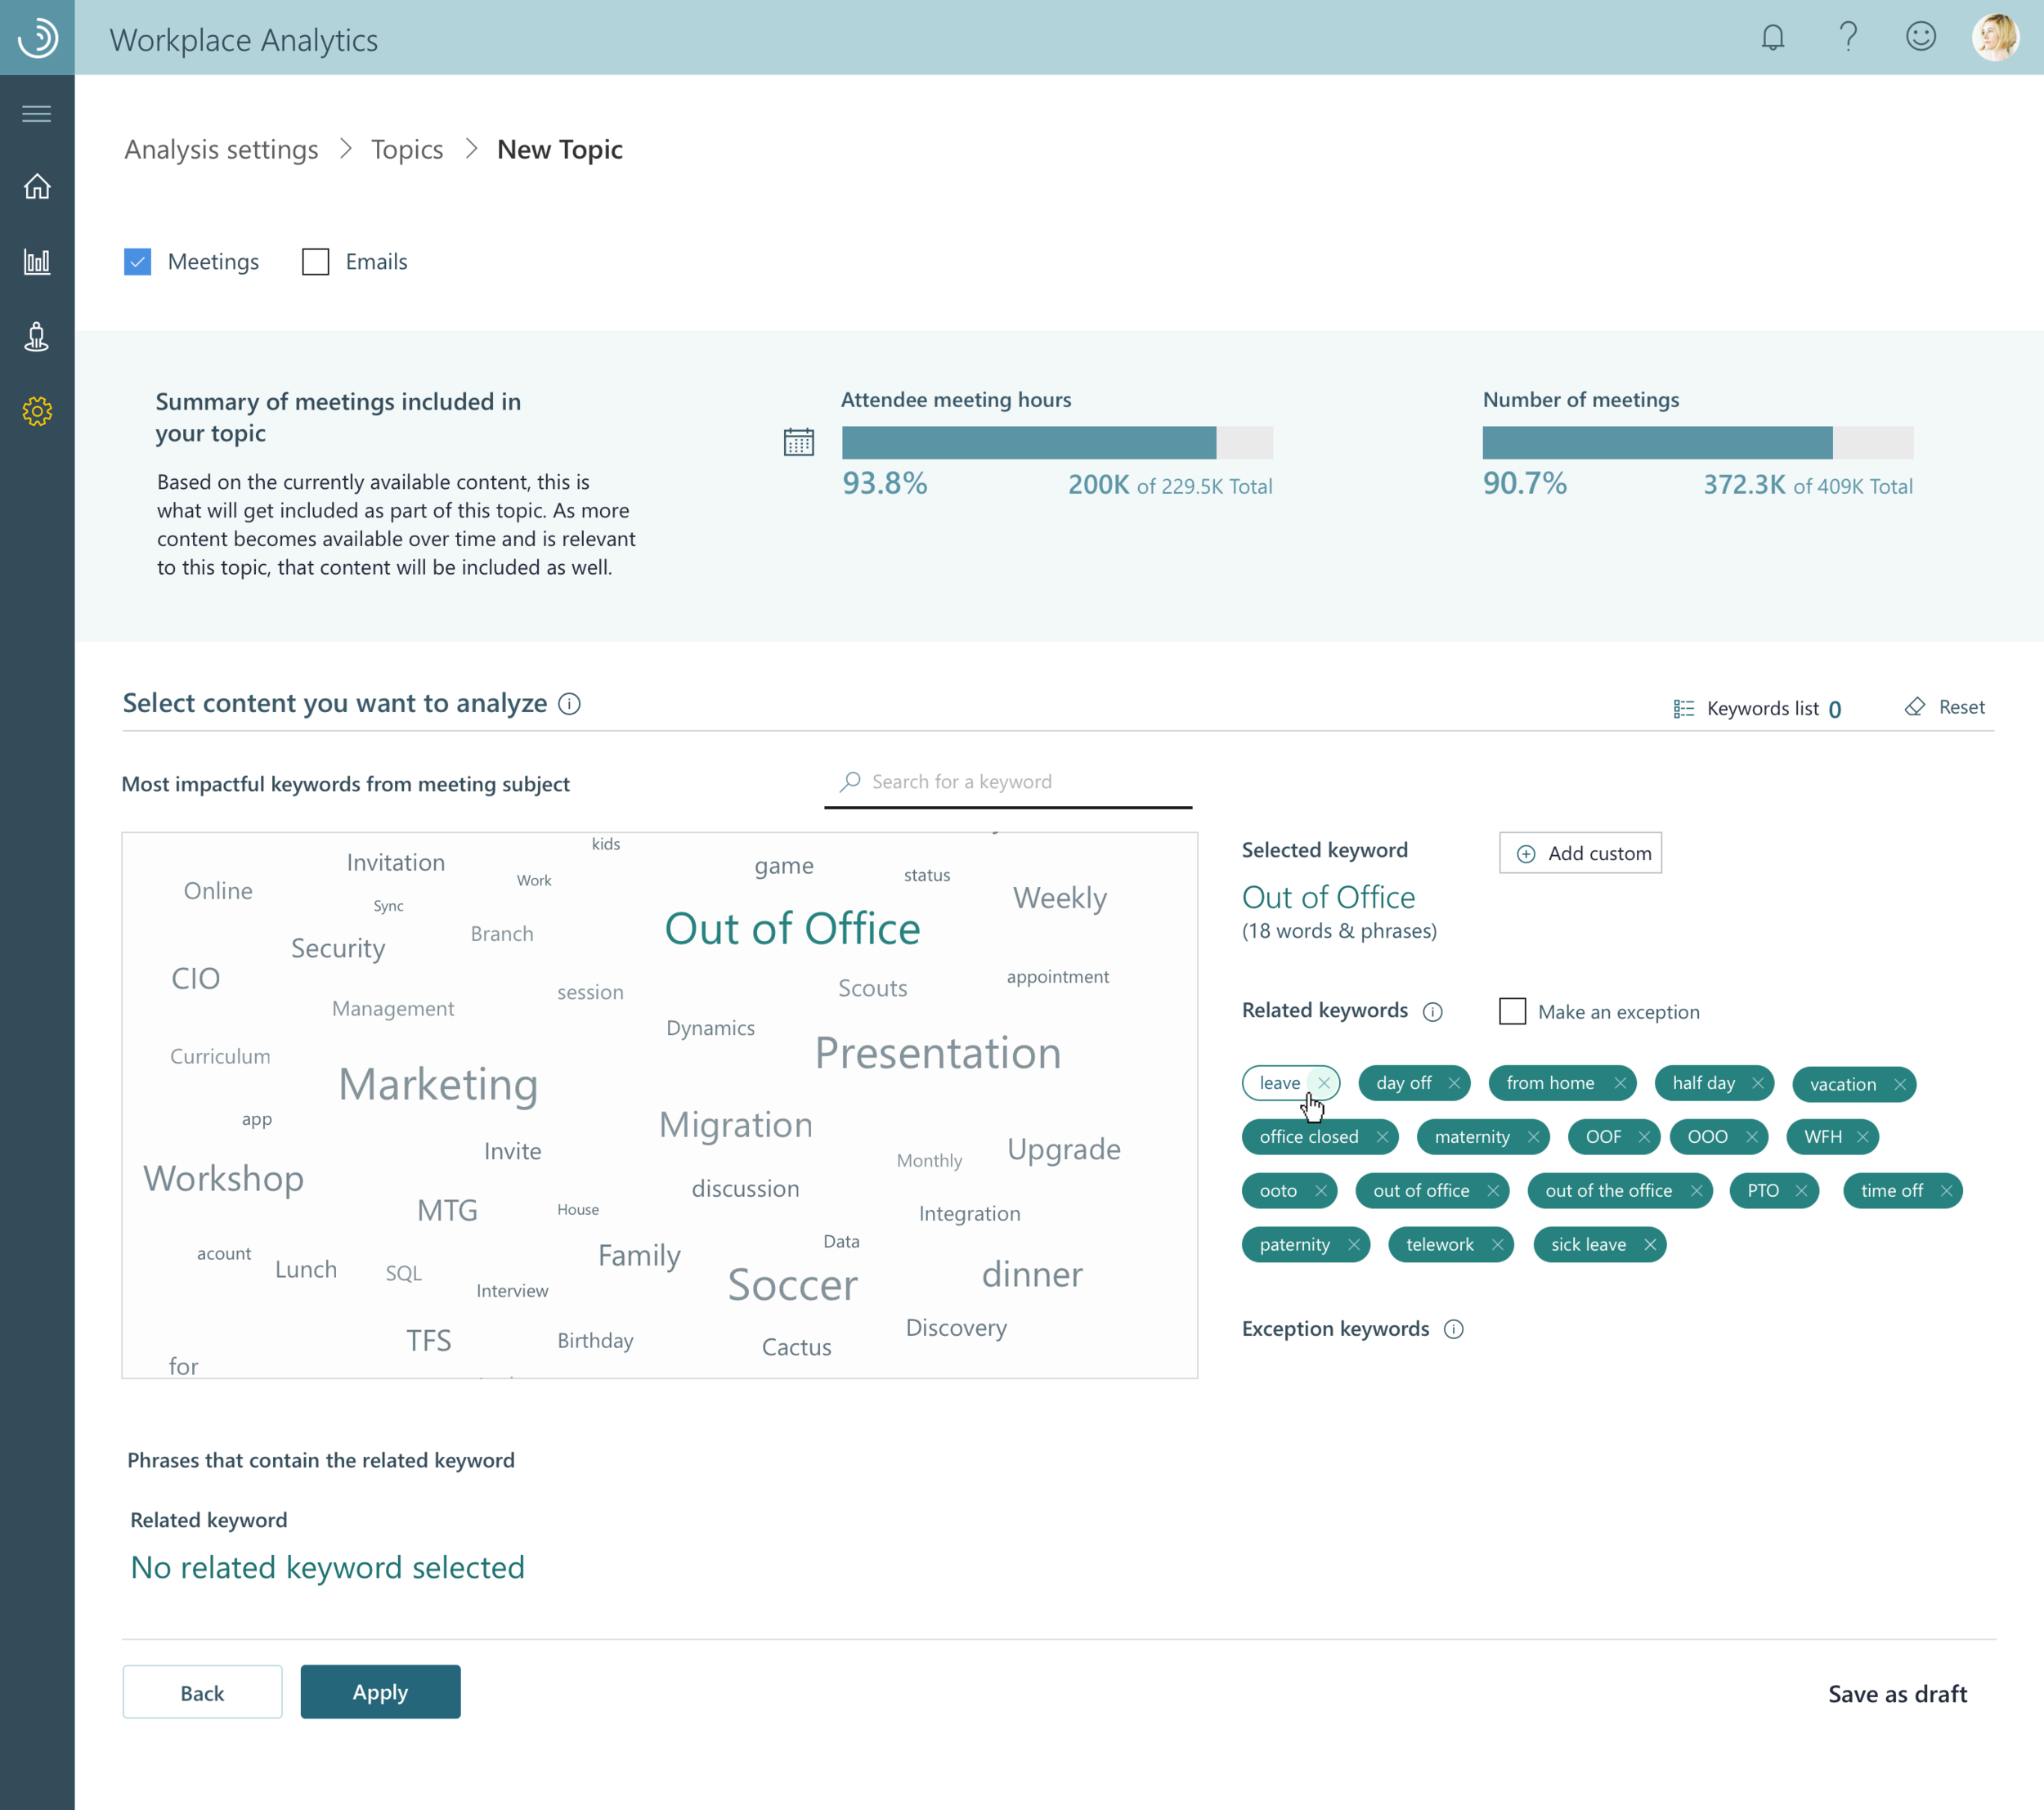
As these features were being implemented in the live product, there were two pieces of key feedback from users that informed the next step of design iterations:
The current design had too many steps and left users confused
at where in the process they were at.In the keyword selection process, users wanted to see all the steps in one place. Having to scroll, move around, really impeded this process.


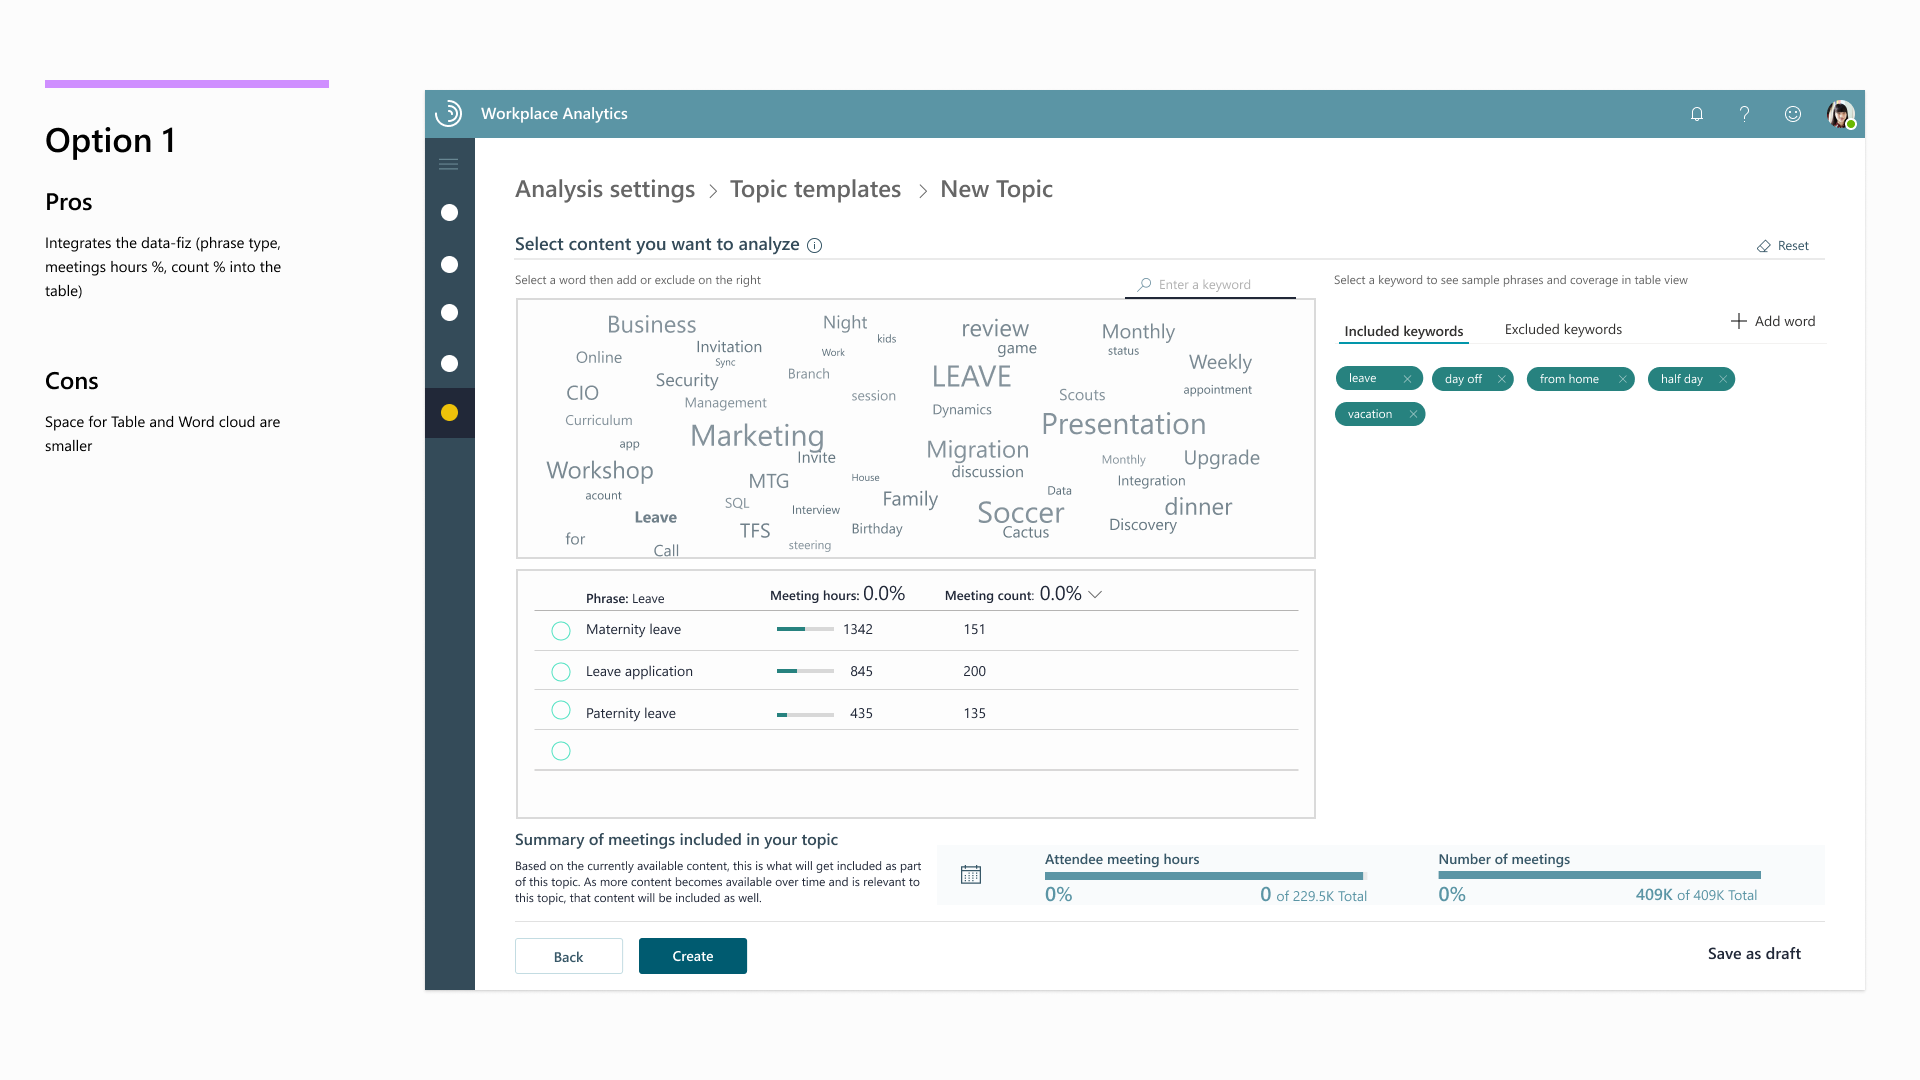
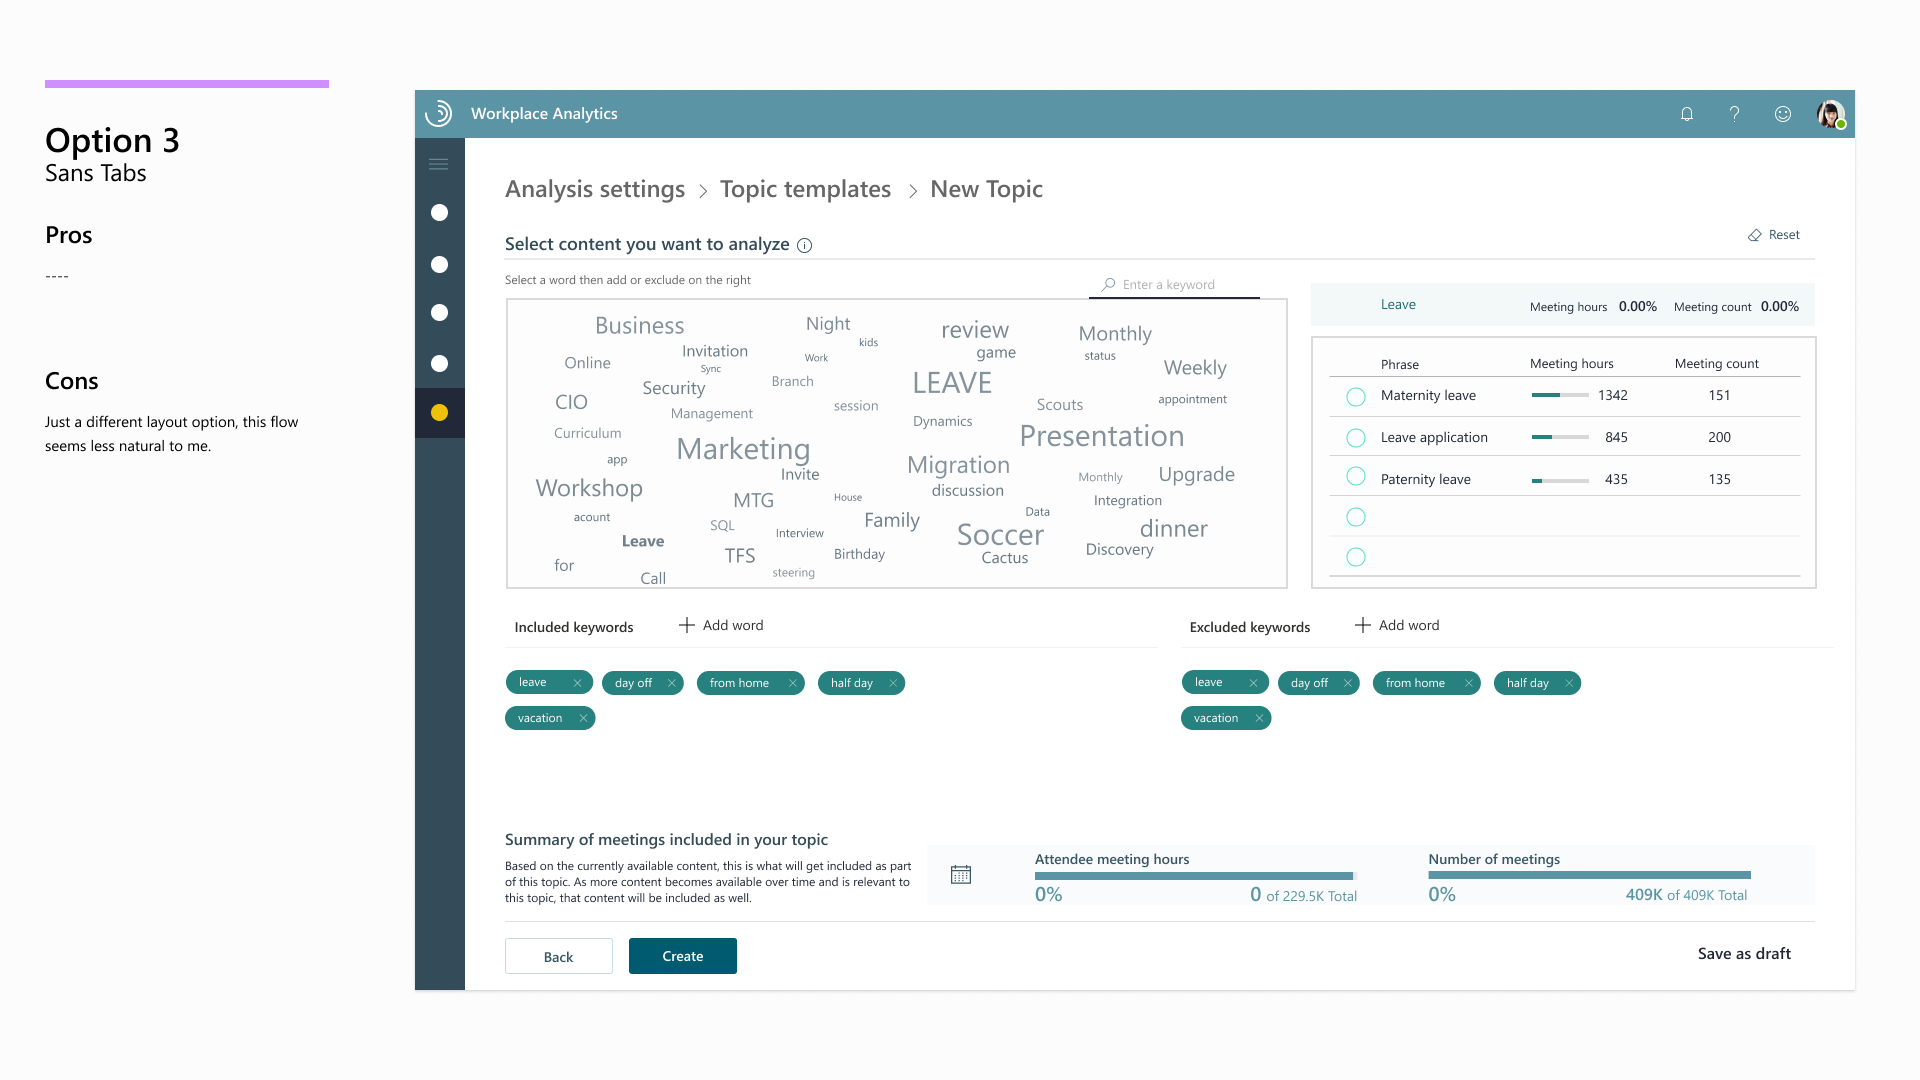
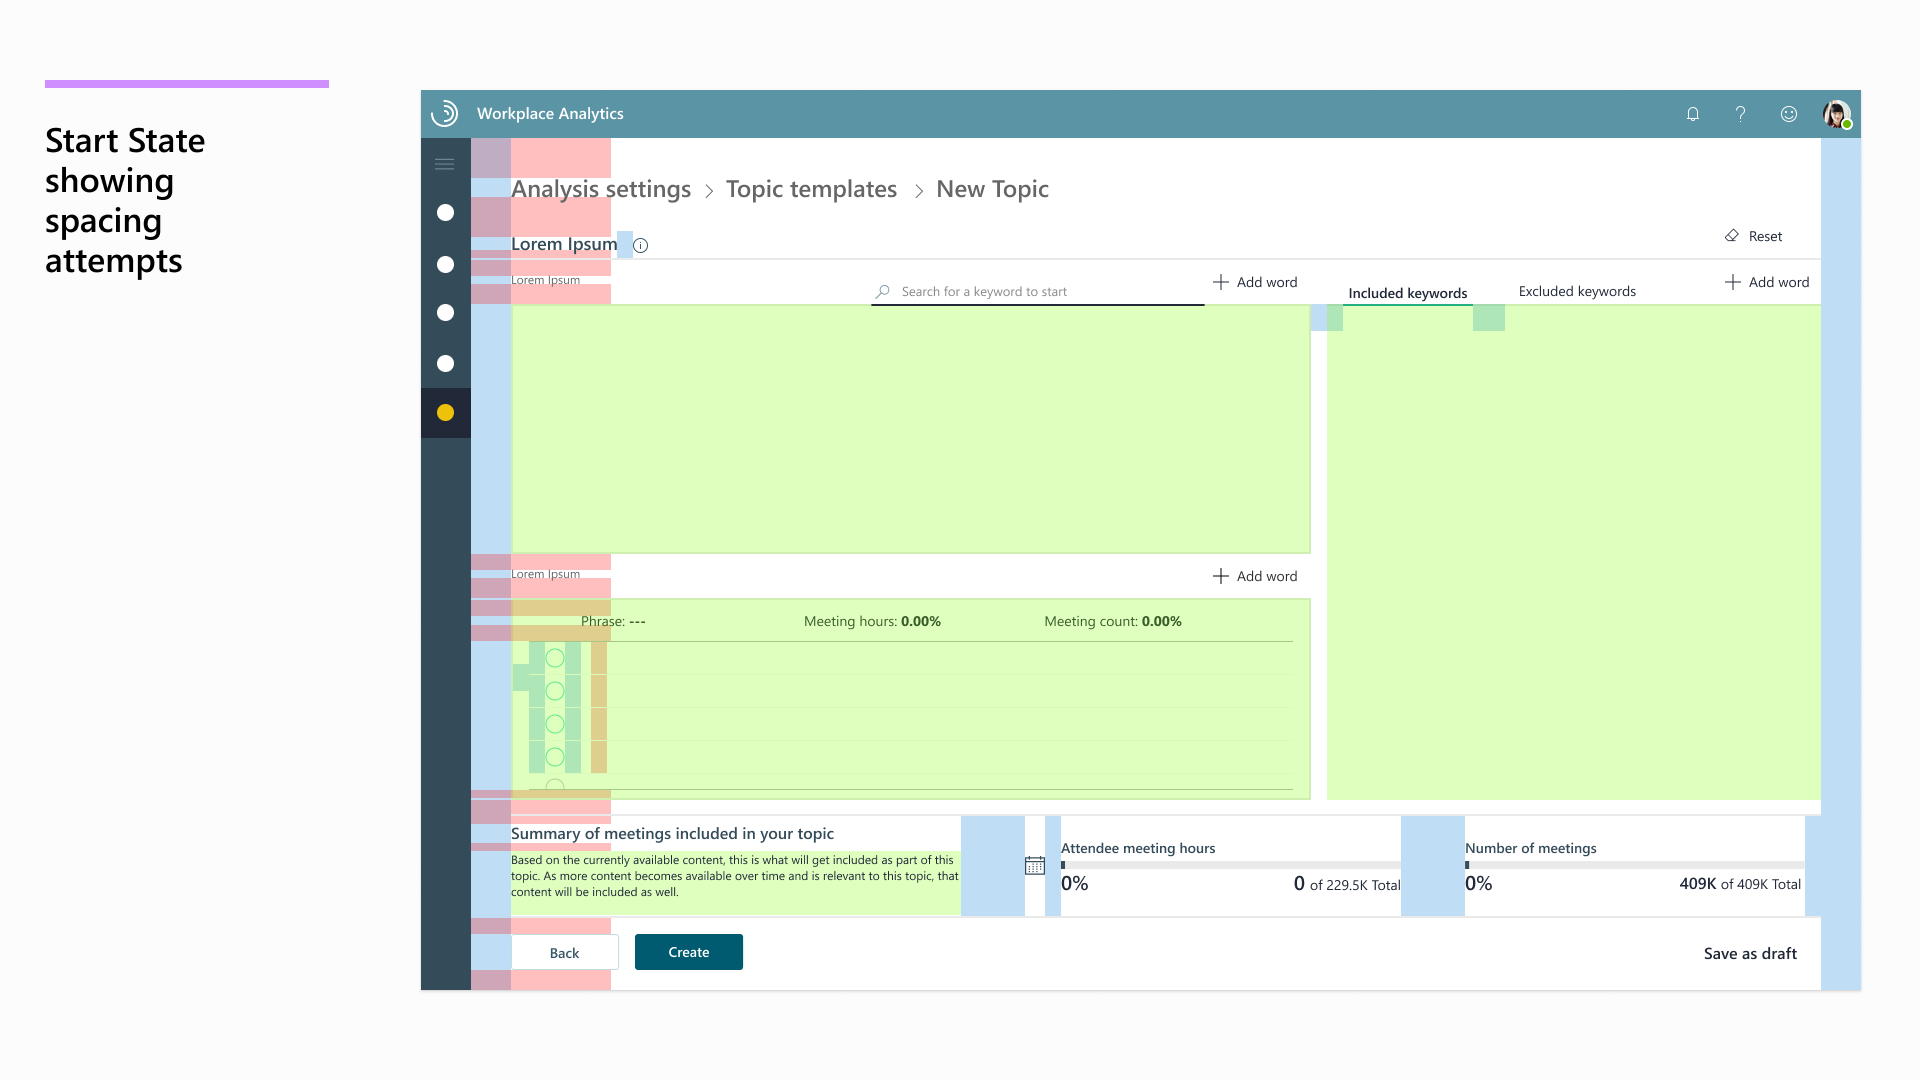
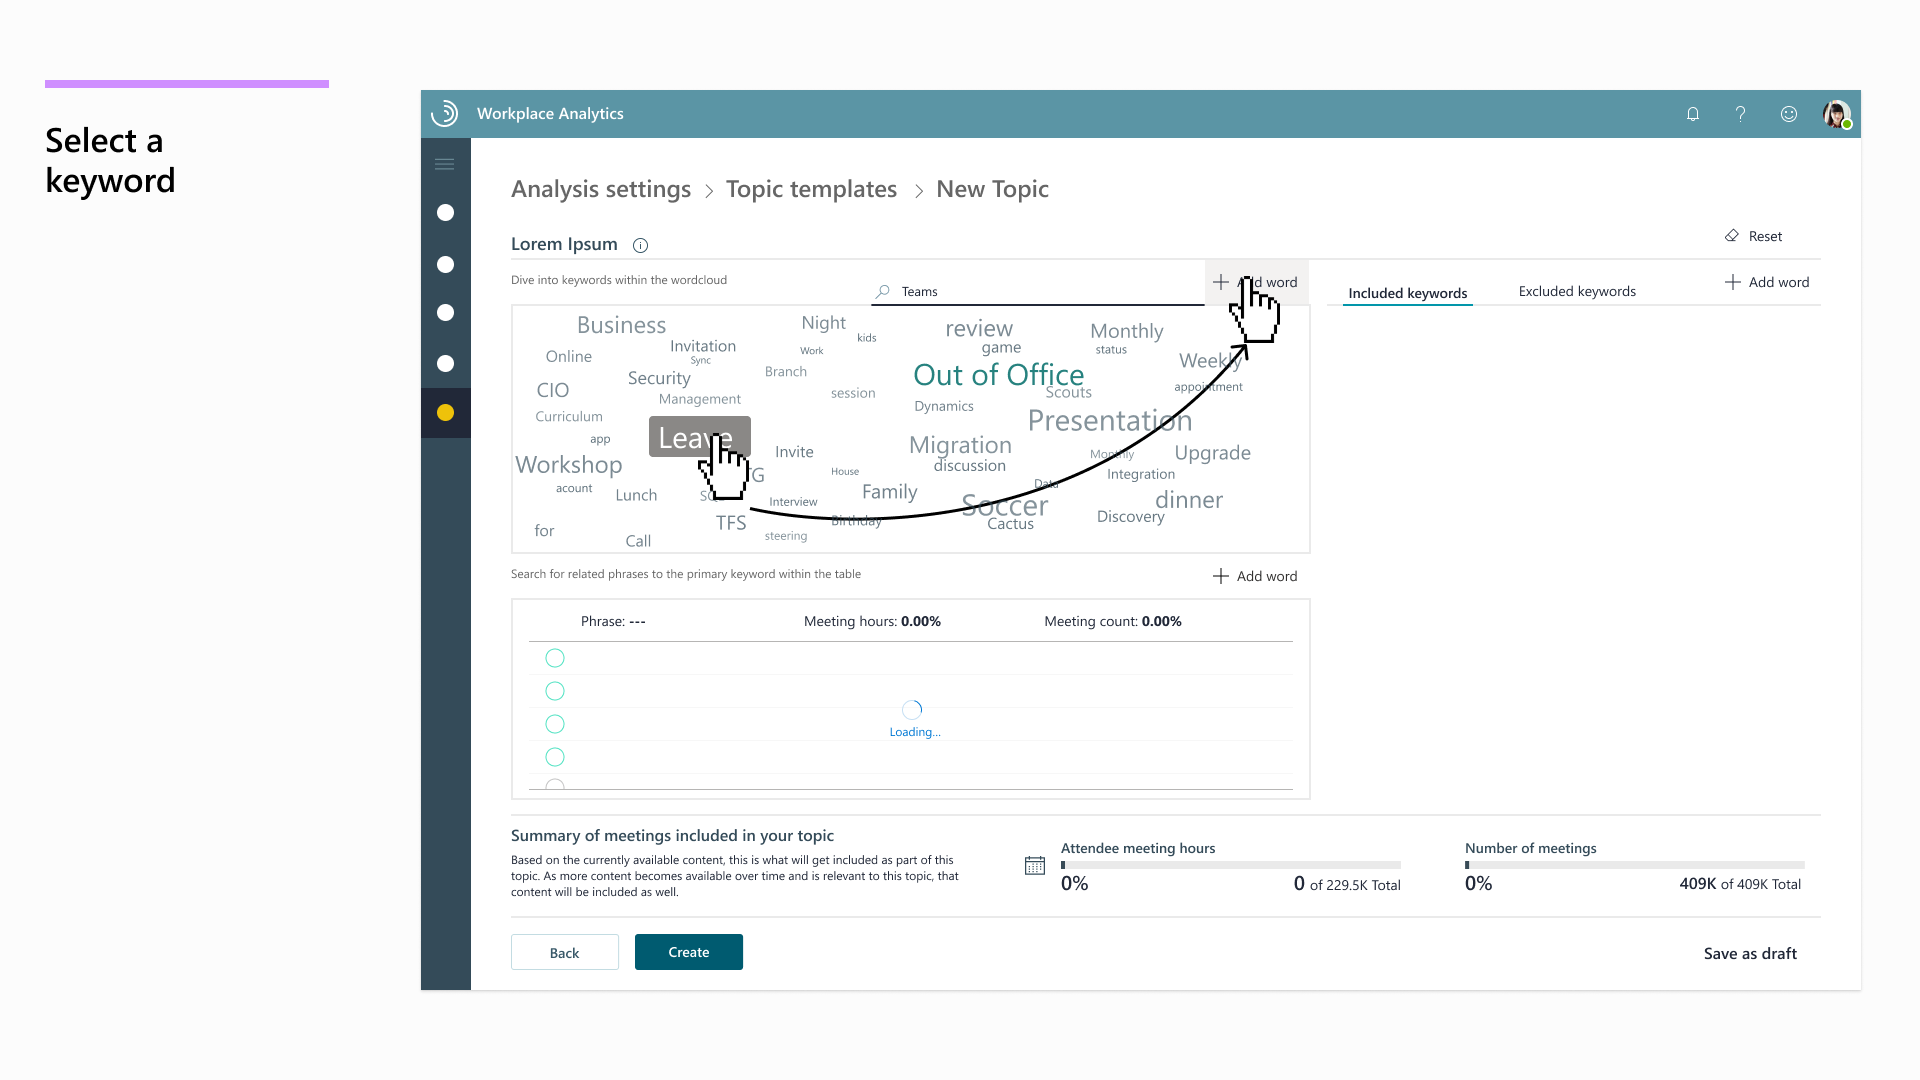
Multiple layout iterations and user testing to move to a more dense design
I realize that white space is important for design. I’m a fan. In this scenario though the feedback and users wanted things closer together. There was the desire for a TOOL not just a FLOW. The current design turned the process more purely into a flow process, something akin to a wizard. My goal in these steps was to turn it into a tool, a process in which a HR director, Business admin, or IT admin could quickly and easily select the desired keywords (and hopefully, from a more mobile computer as the new design embraced better responsive concepts.
I provided multiple layout options to PM and Engineering and continued to iterate based on feedback and sizing considerations.
Further testing with stakeholders and users
These designs were revised further and then a corpus of the different designs was laid for comparison, both internally to lead Project managers, other designers within the Office group, and users of the product.


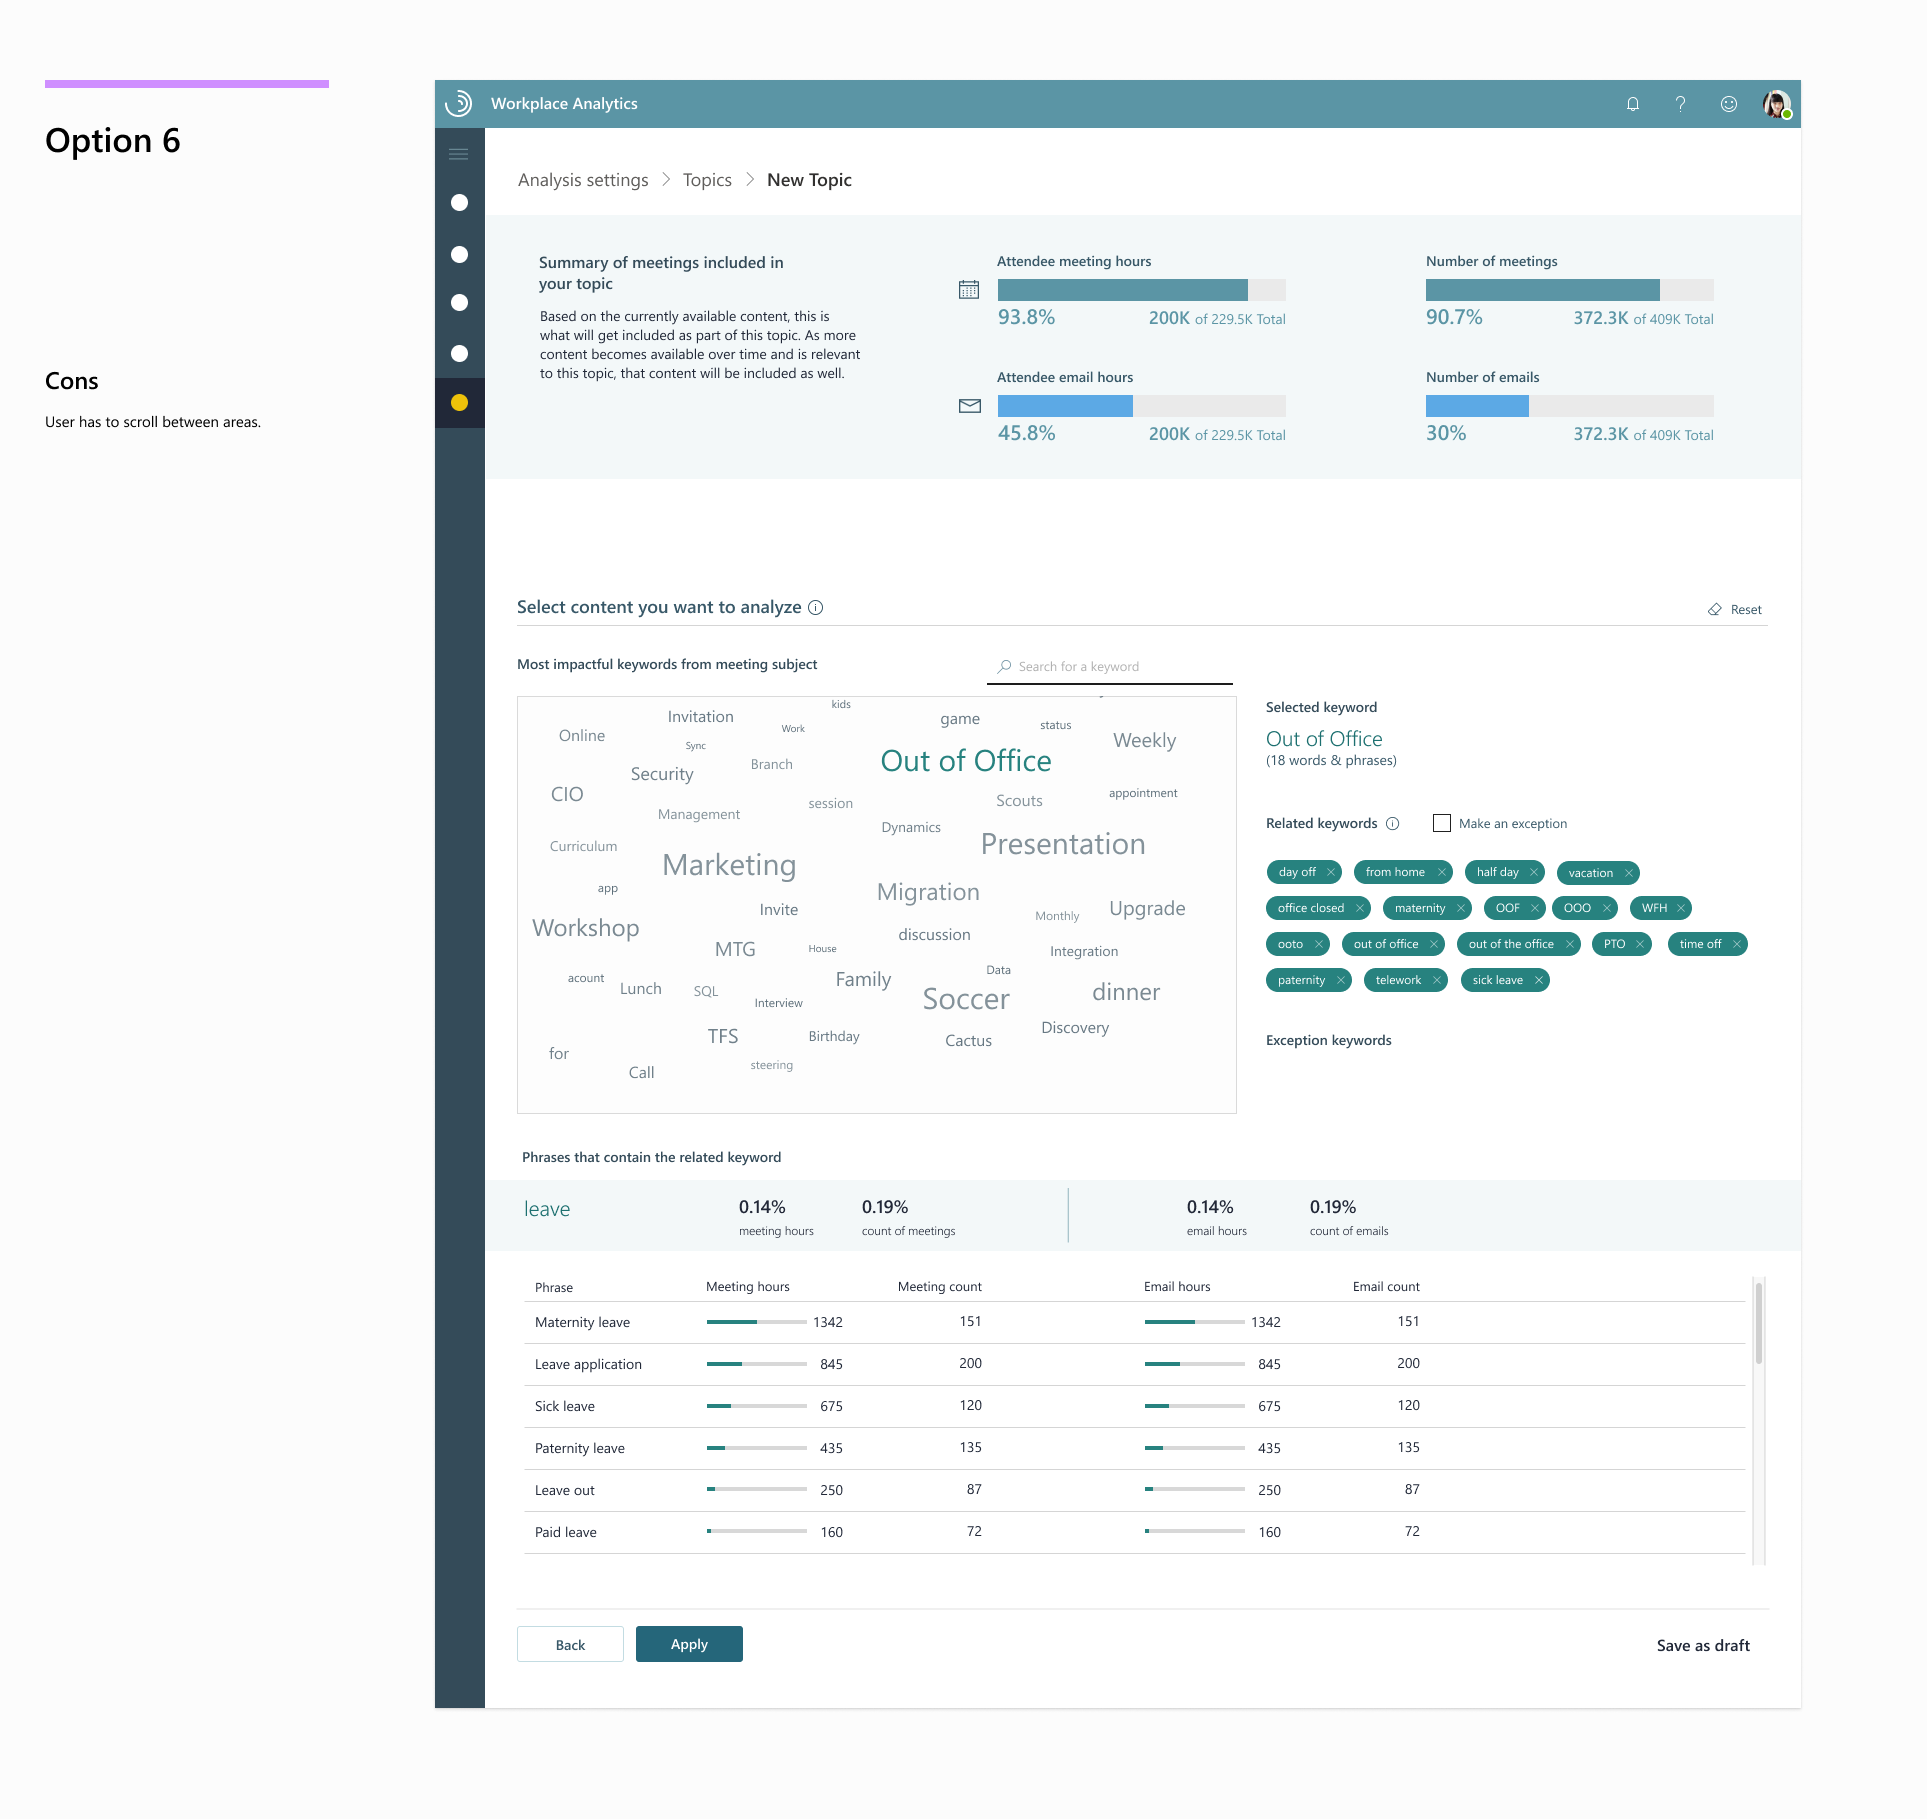
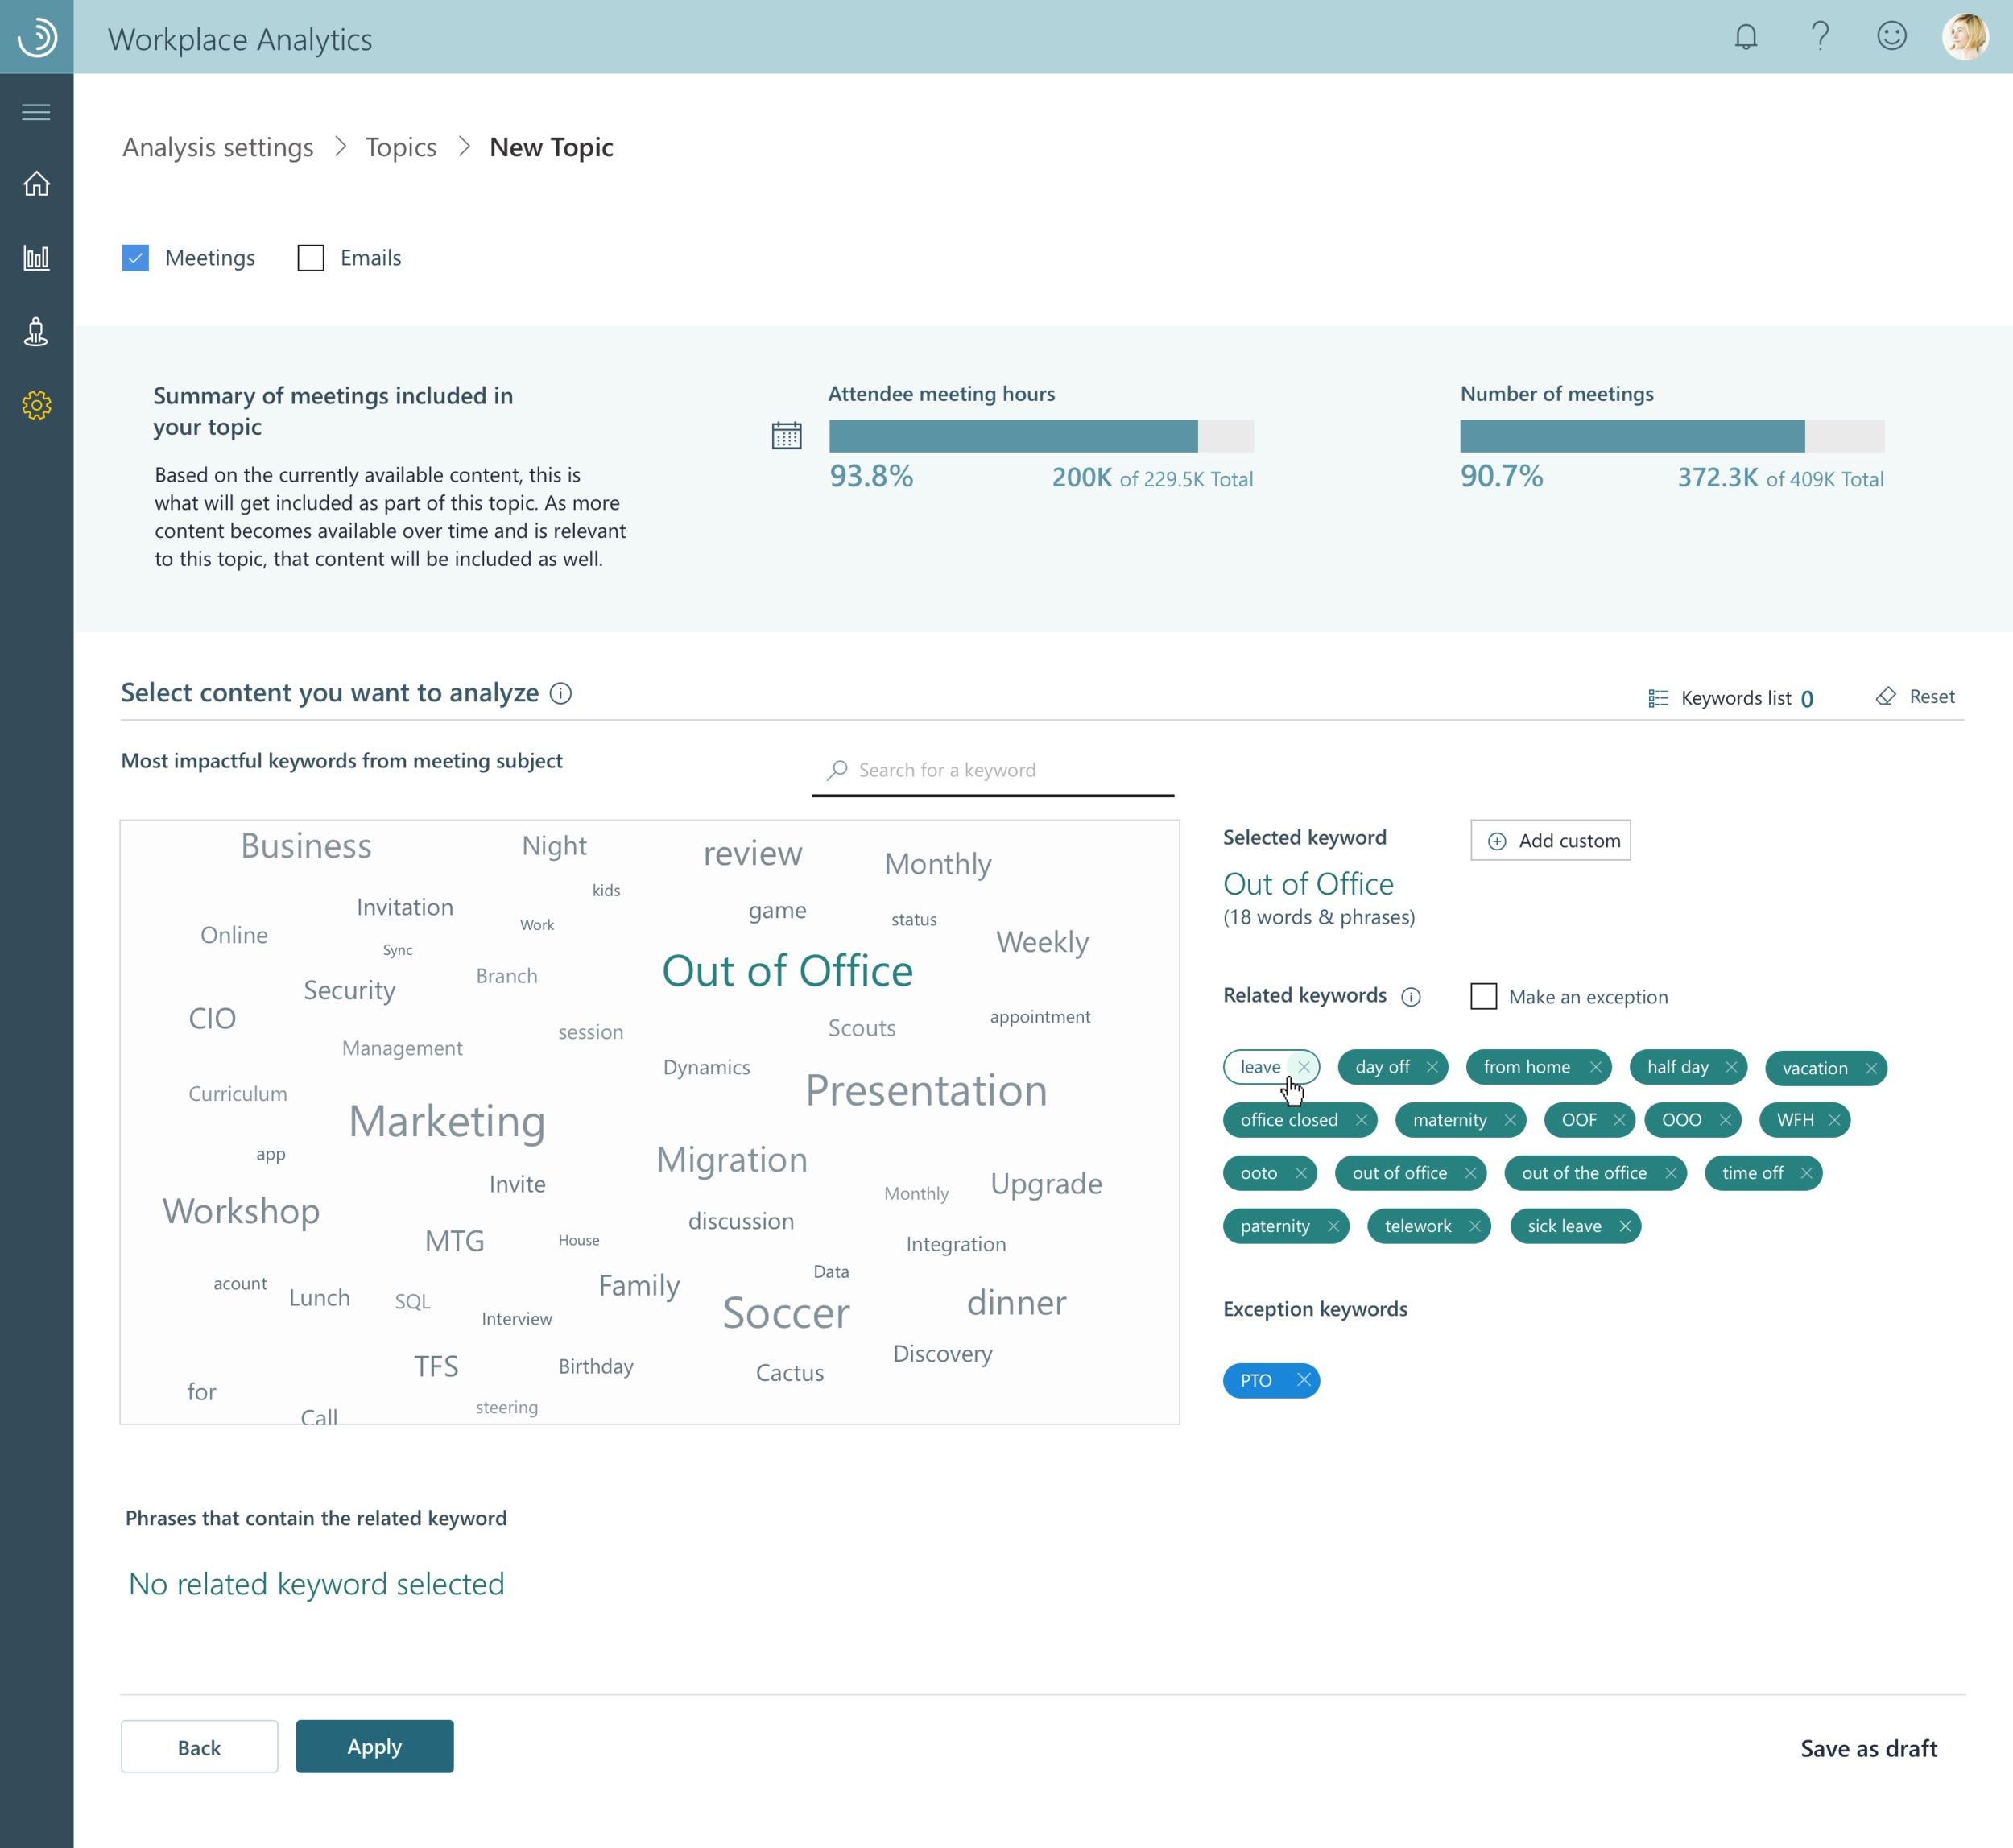
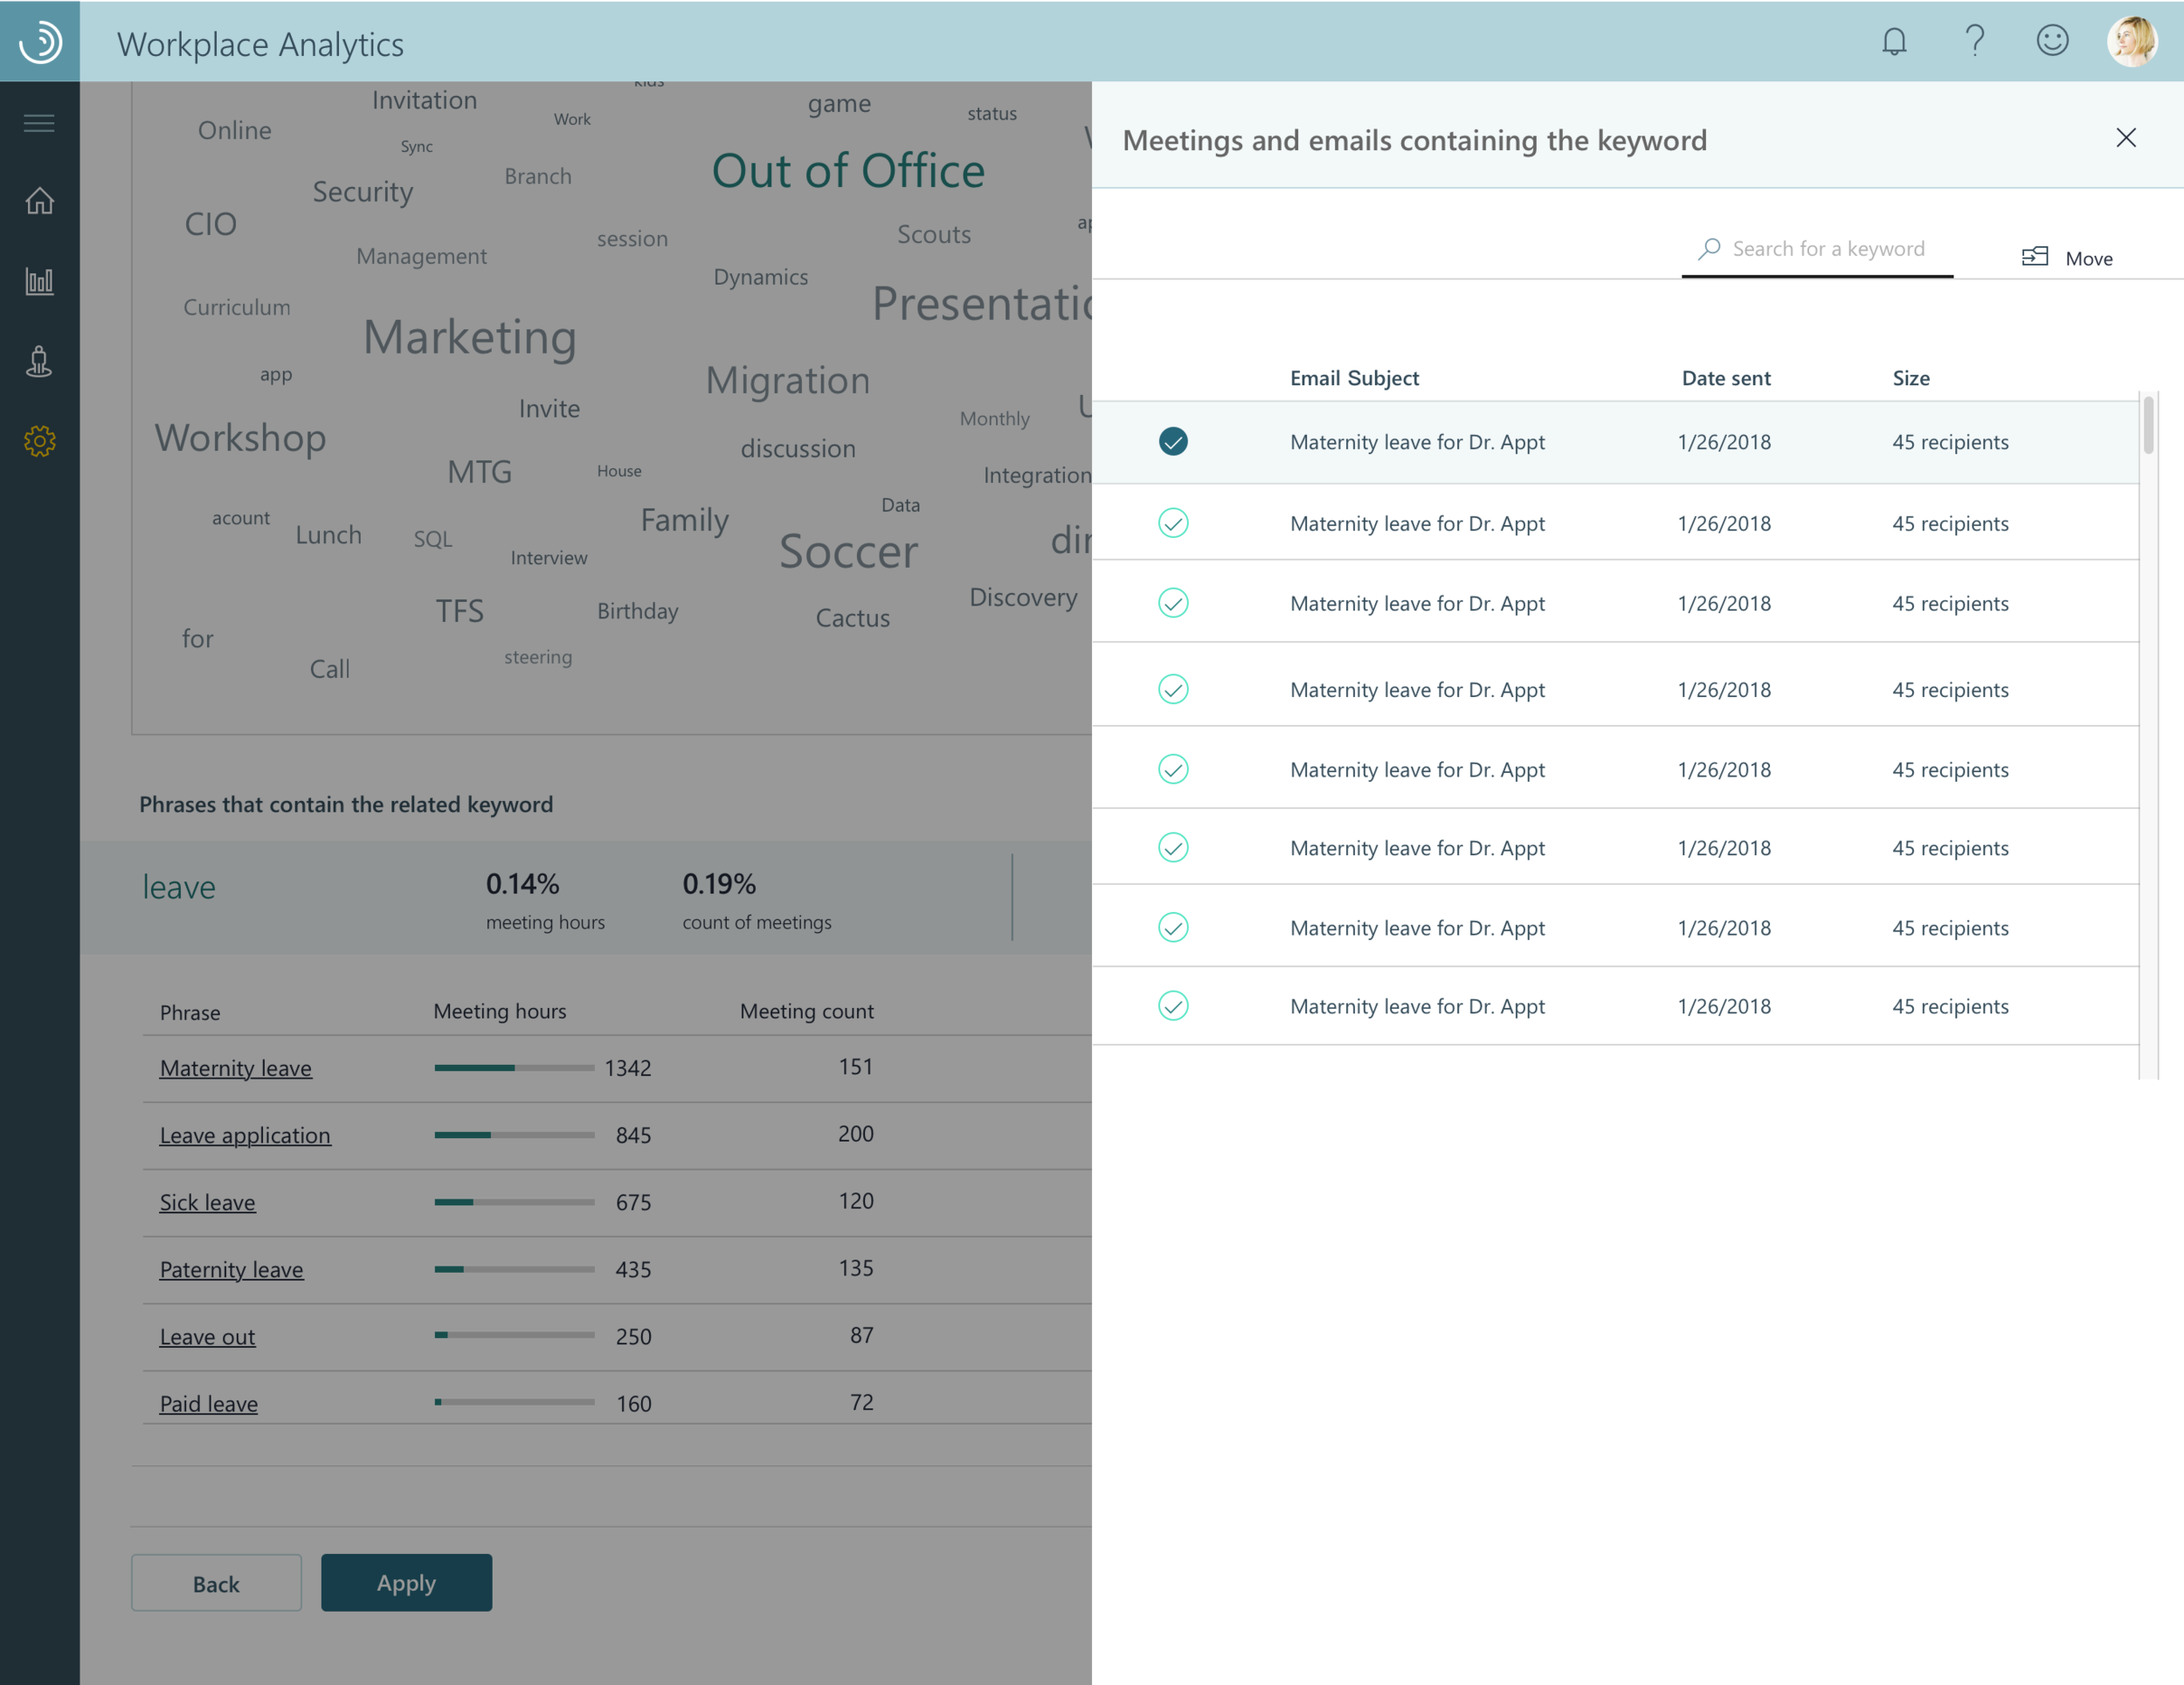
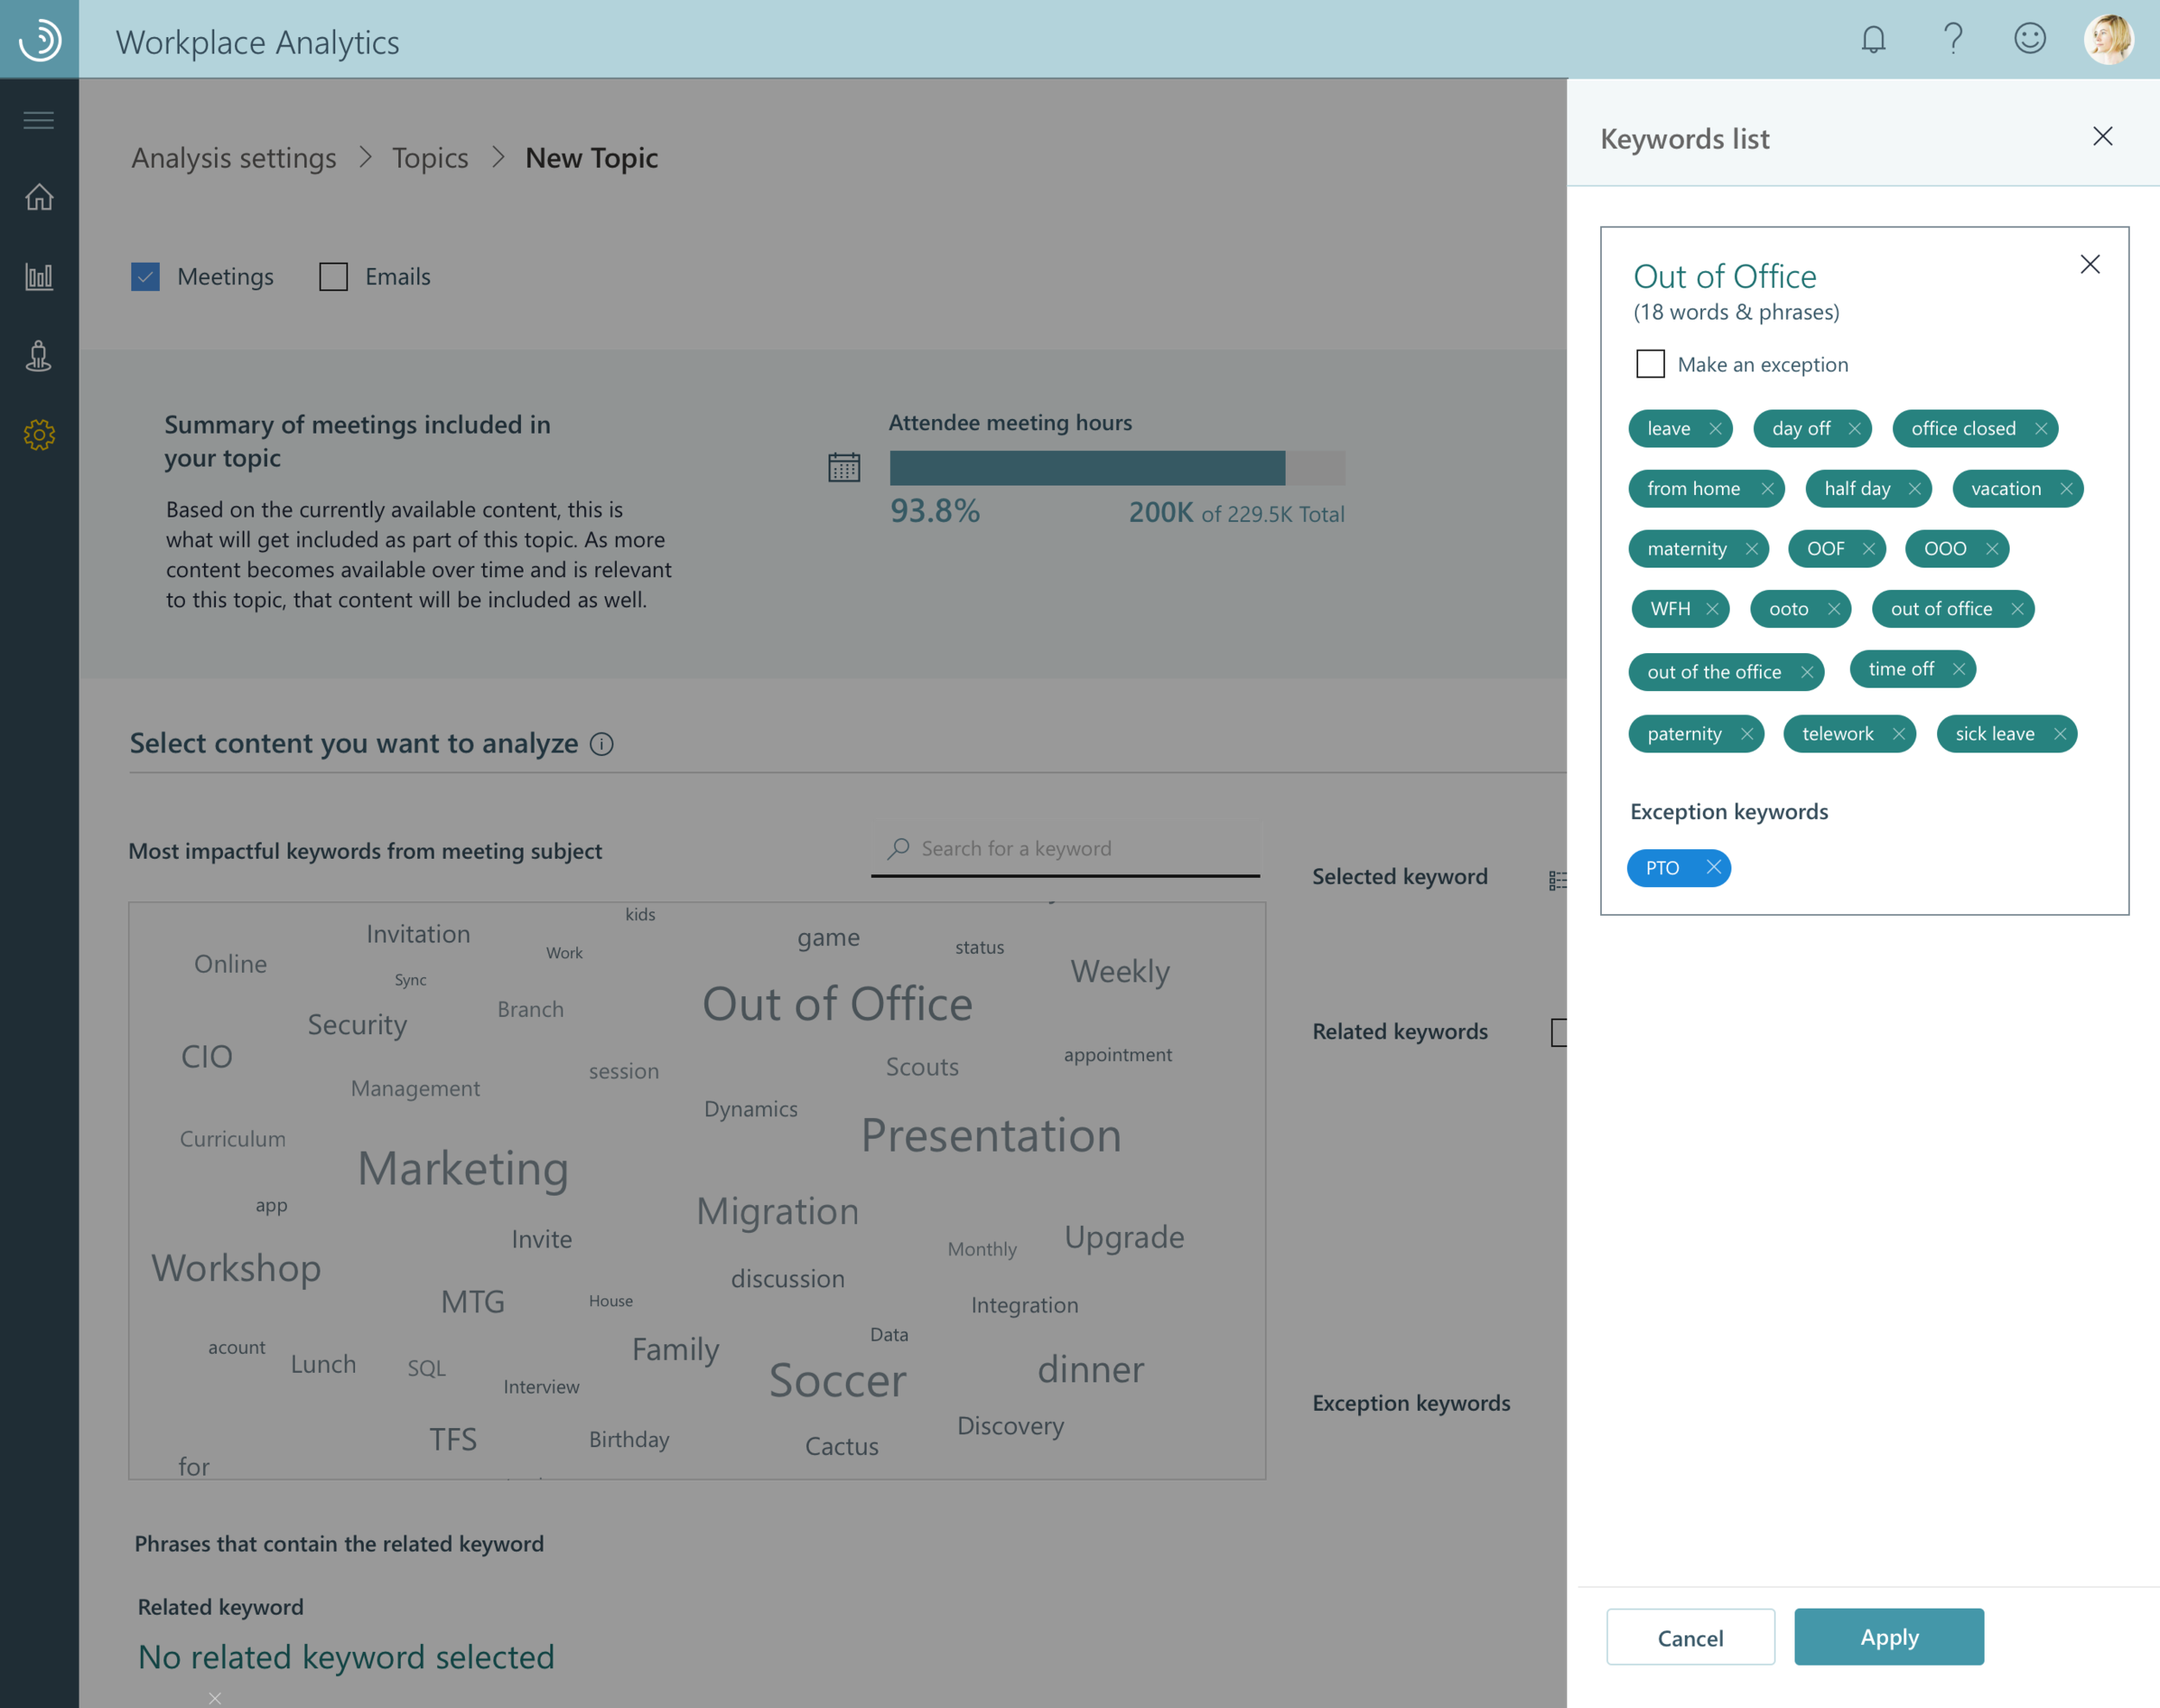
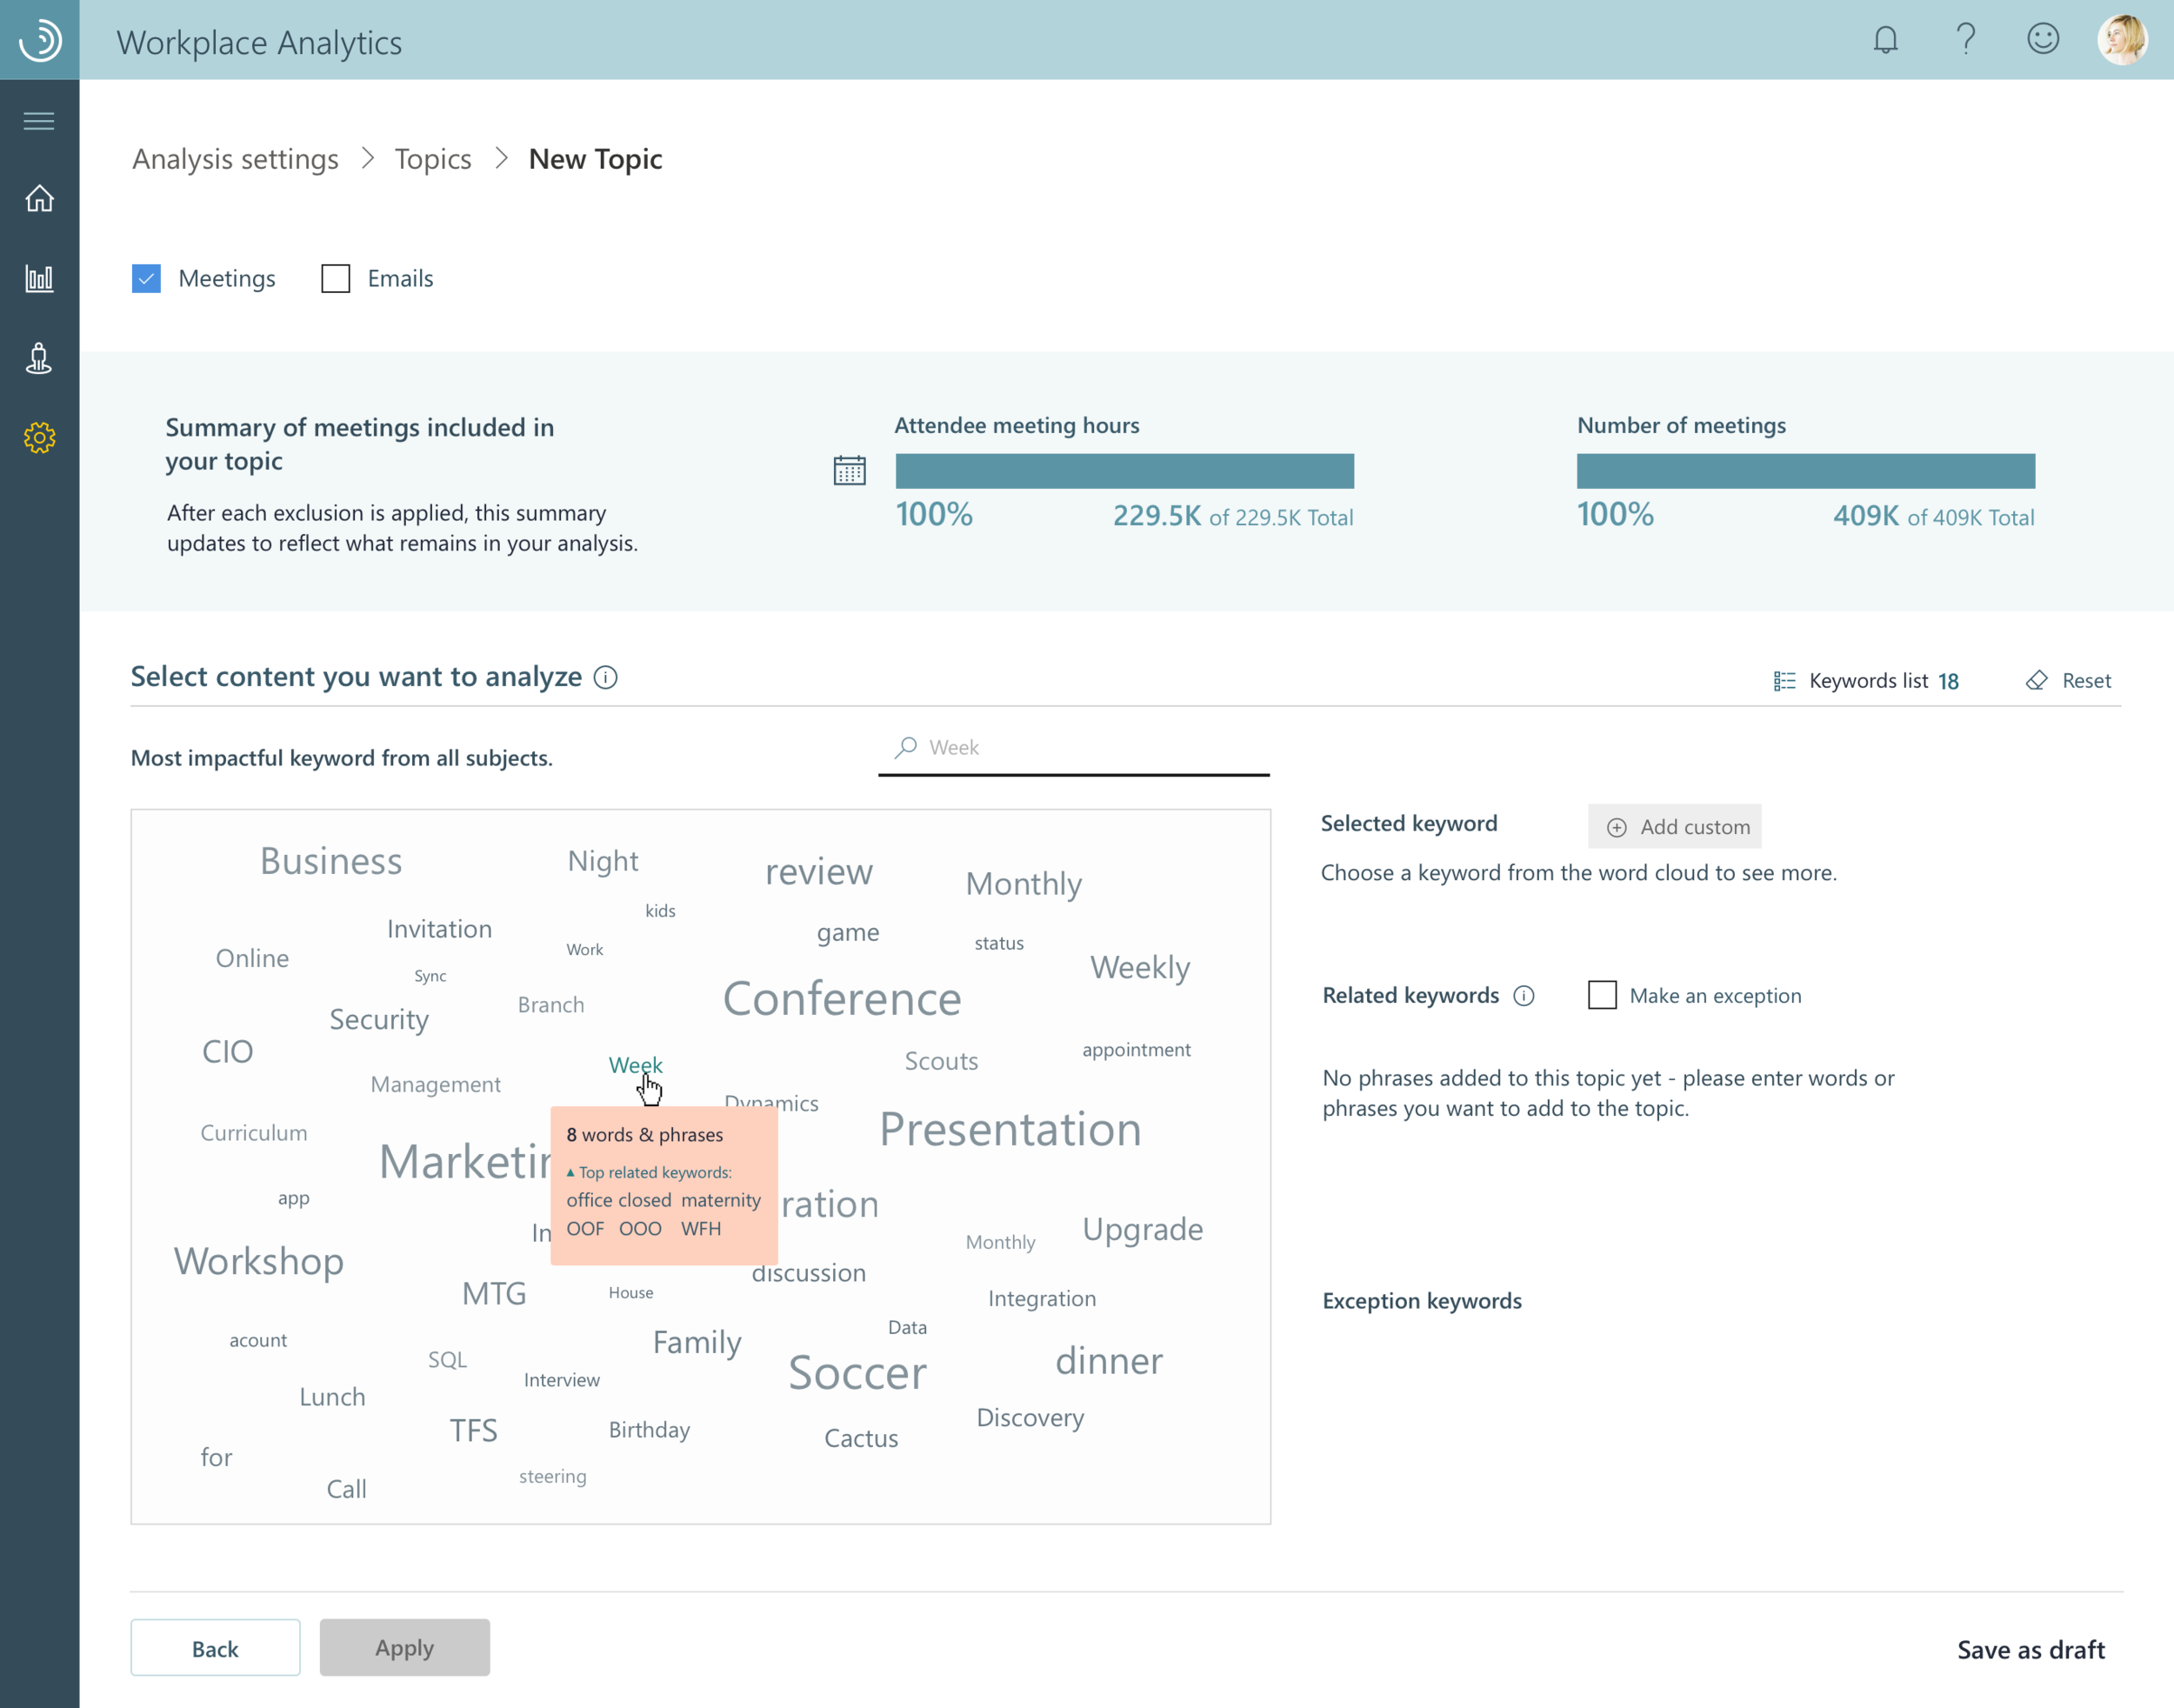
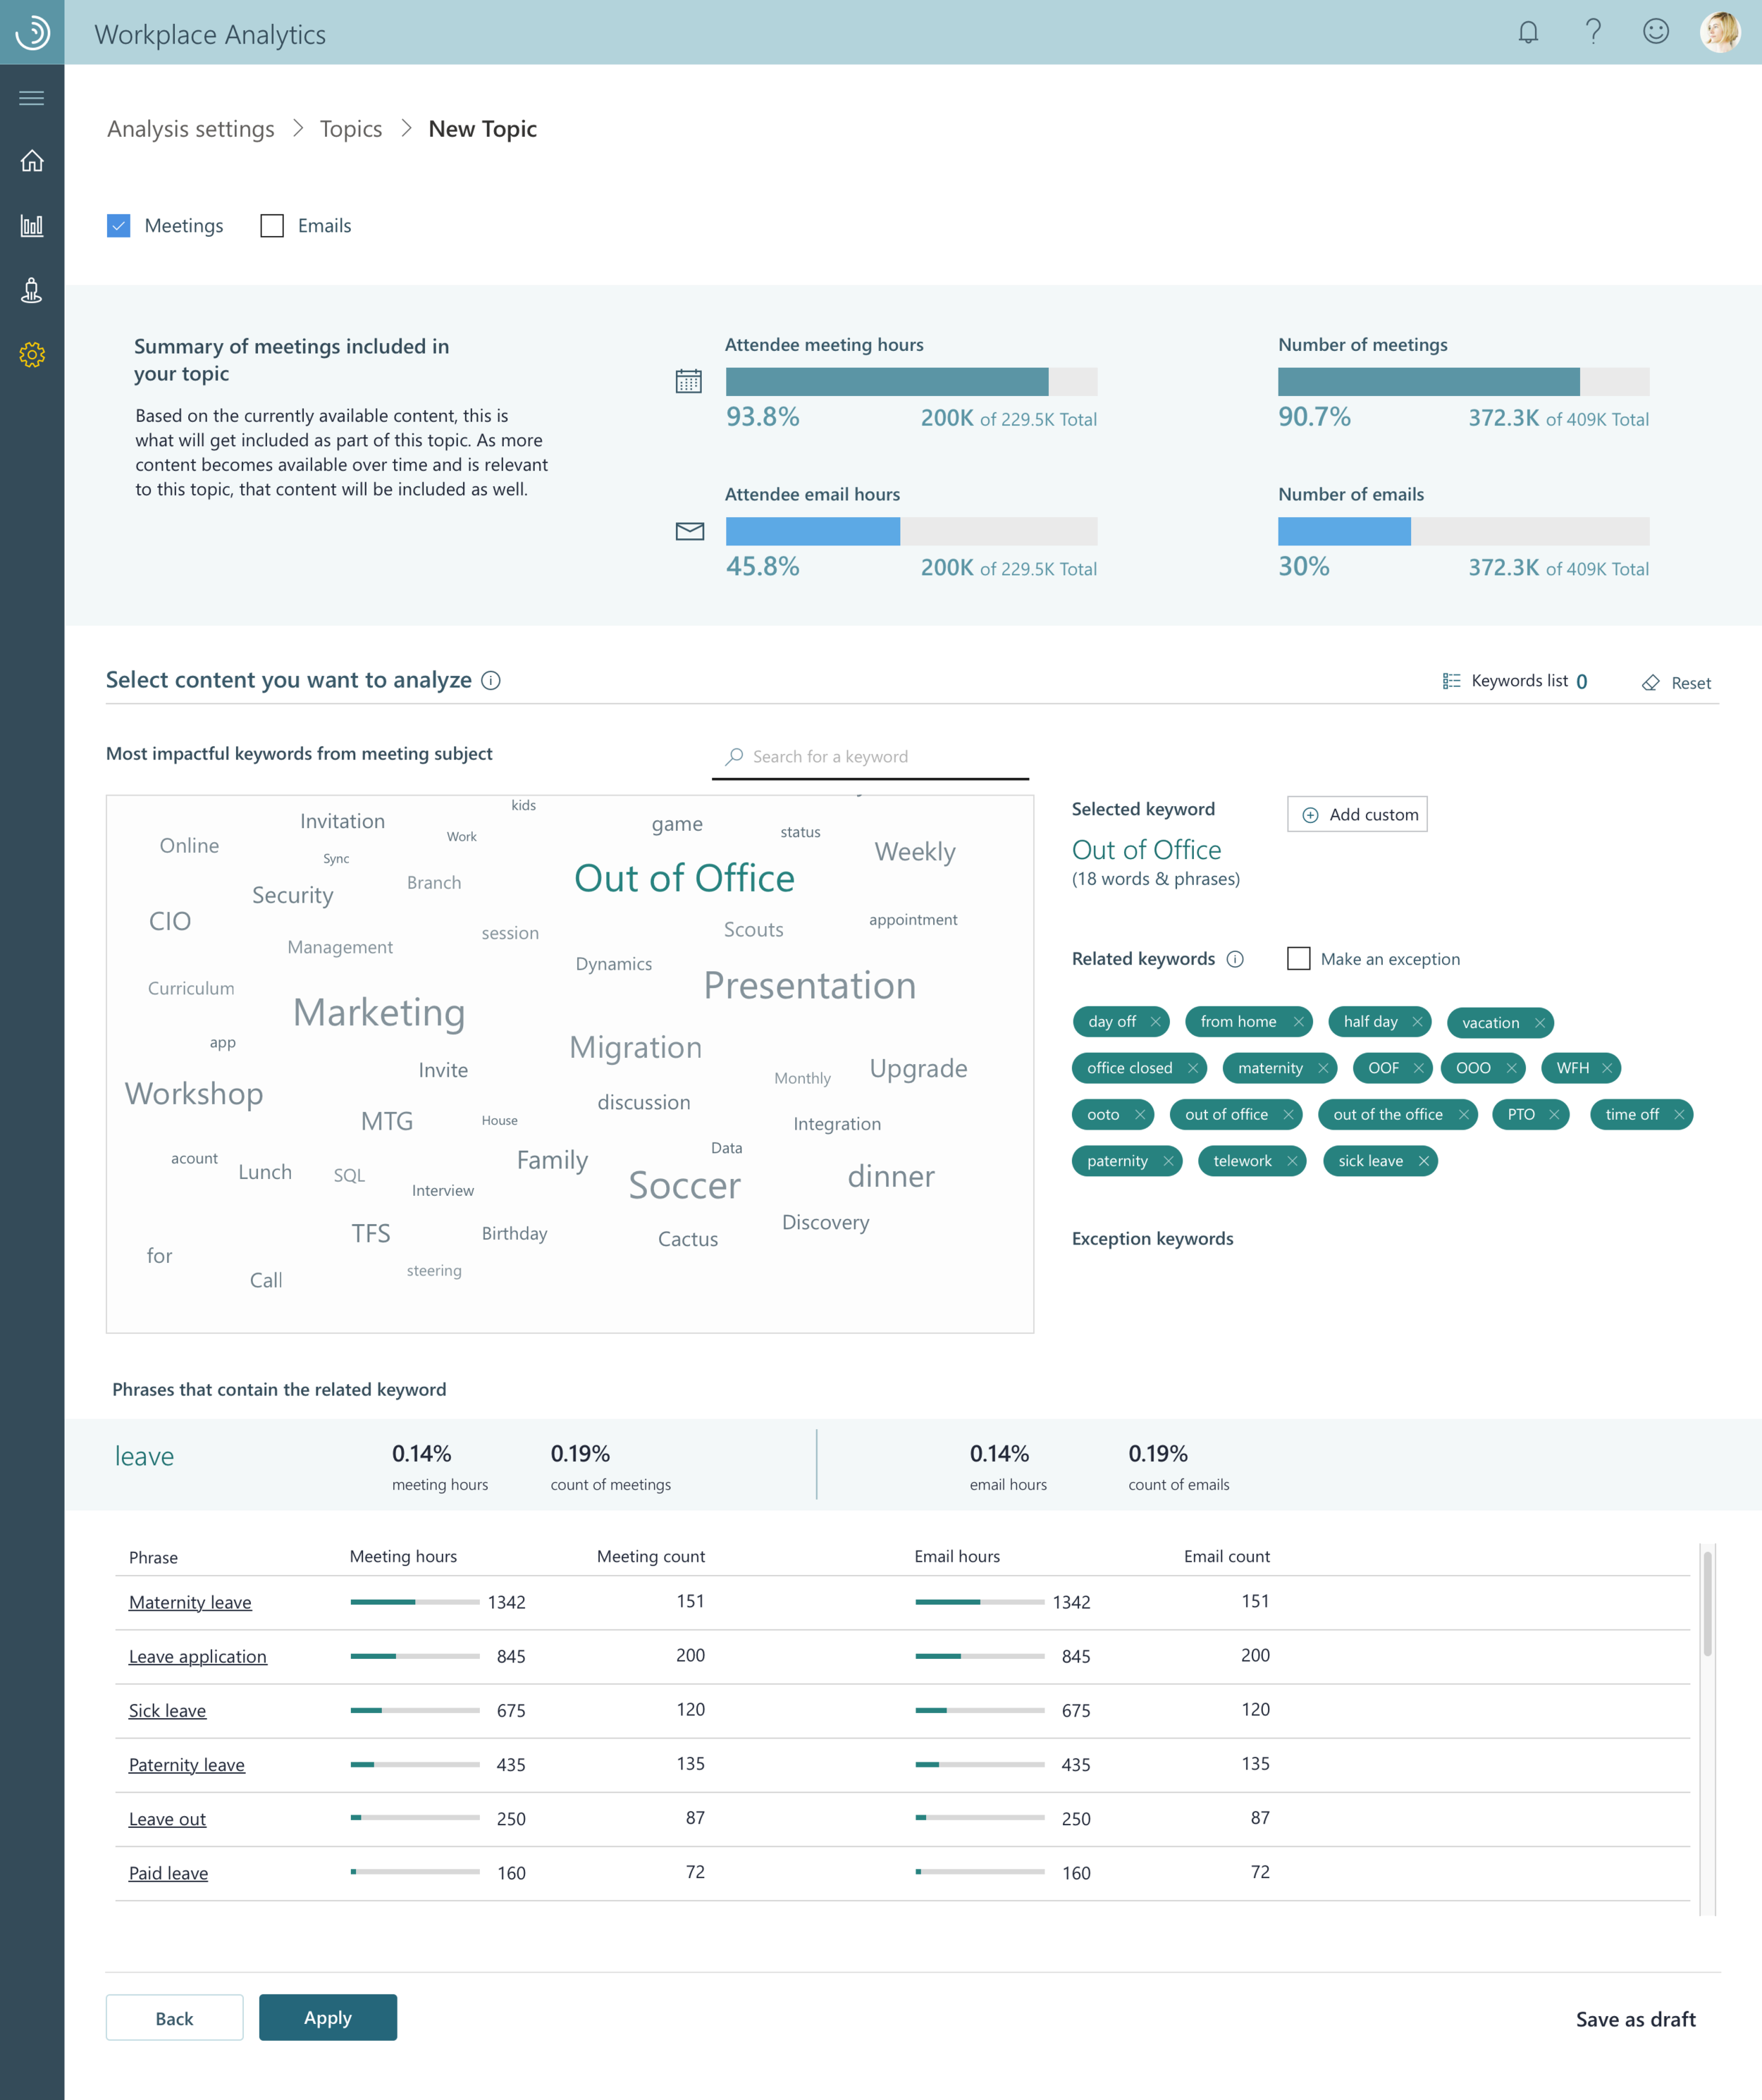
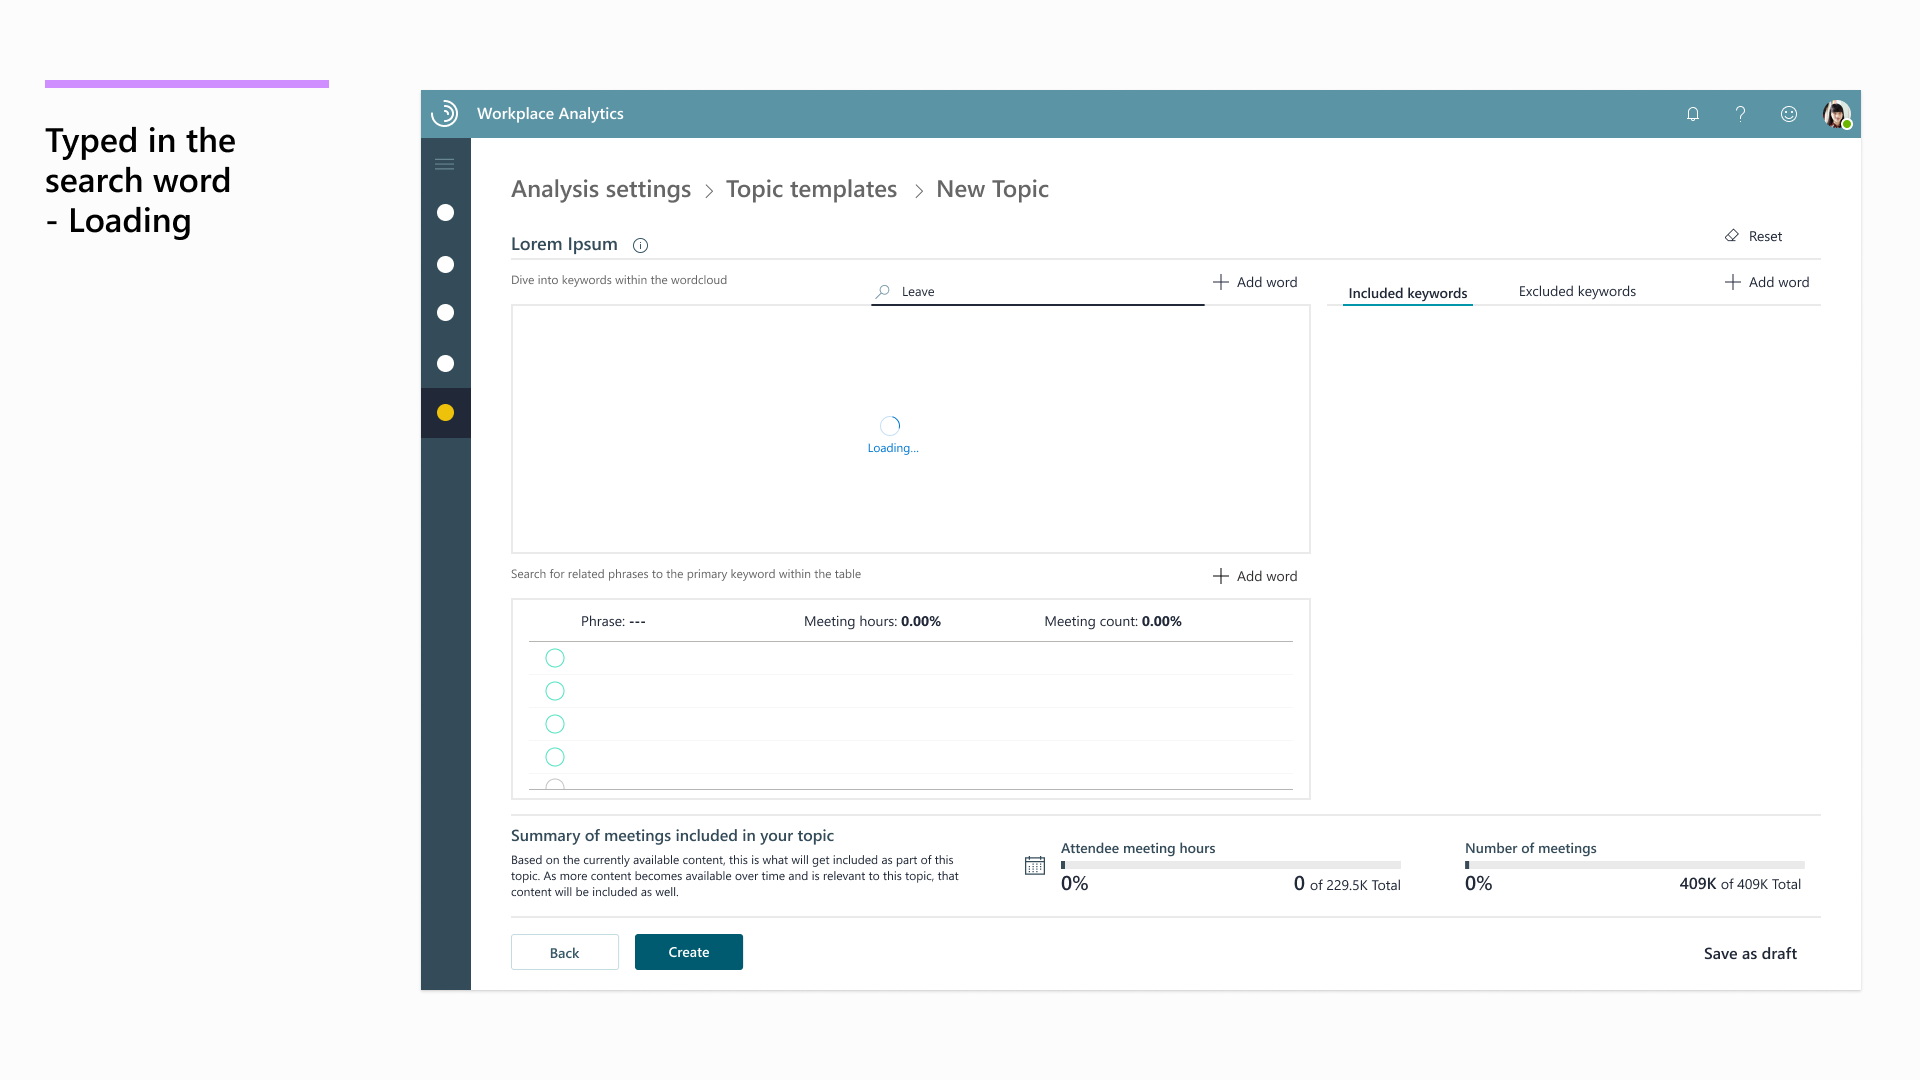
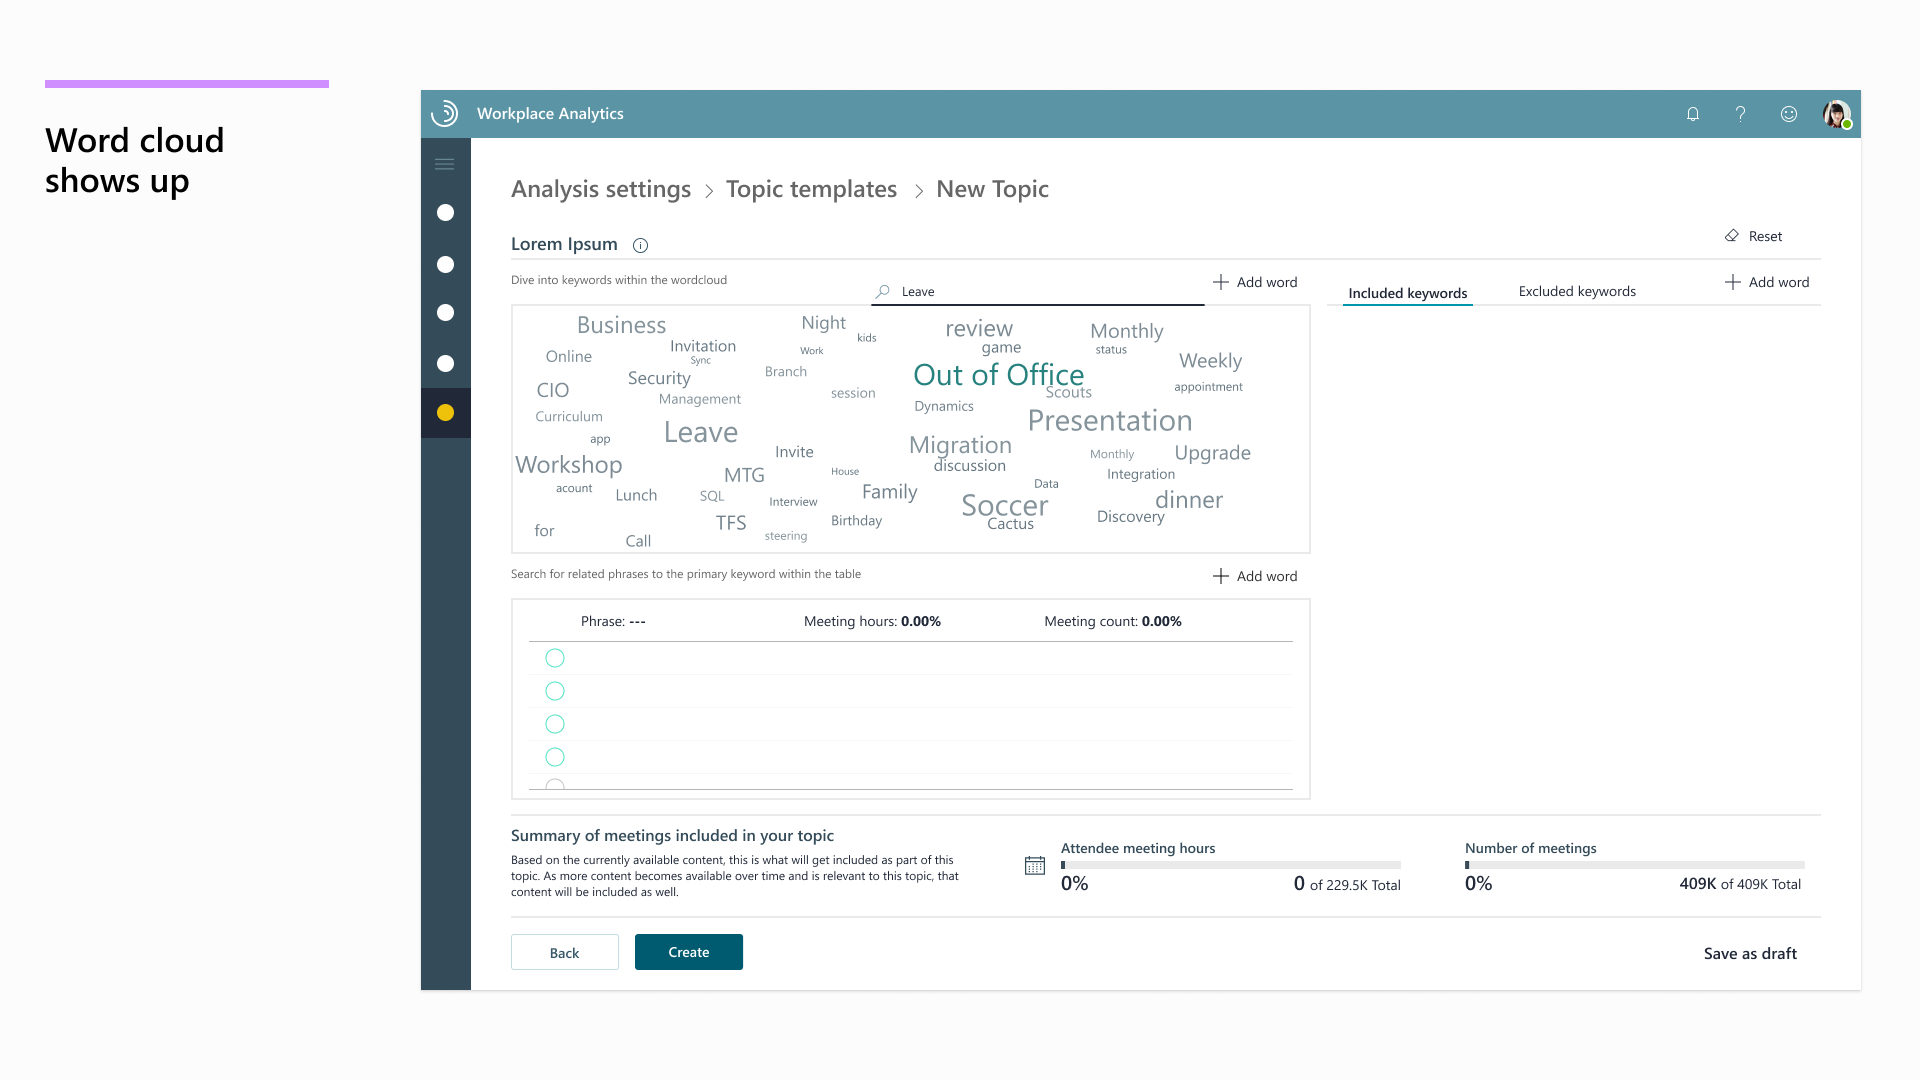
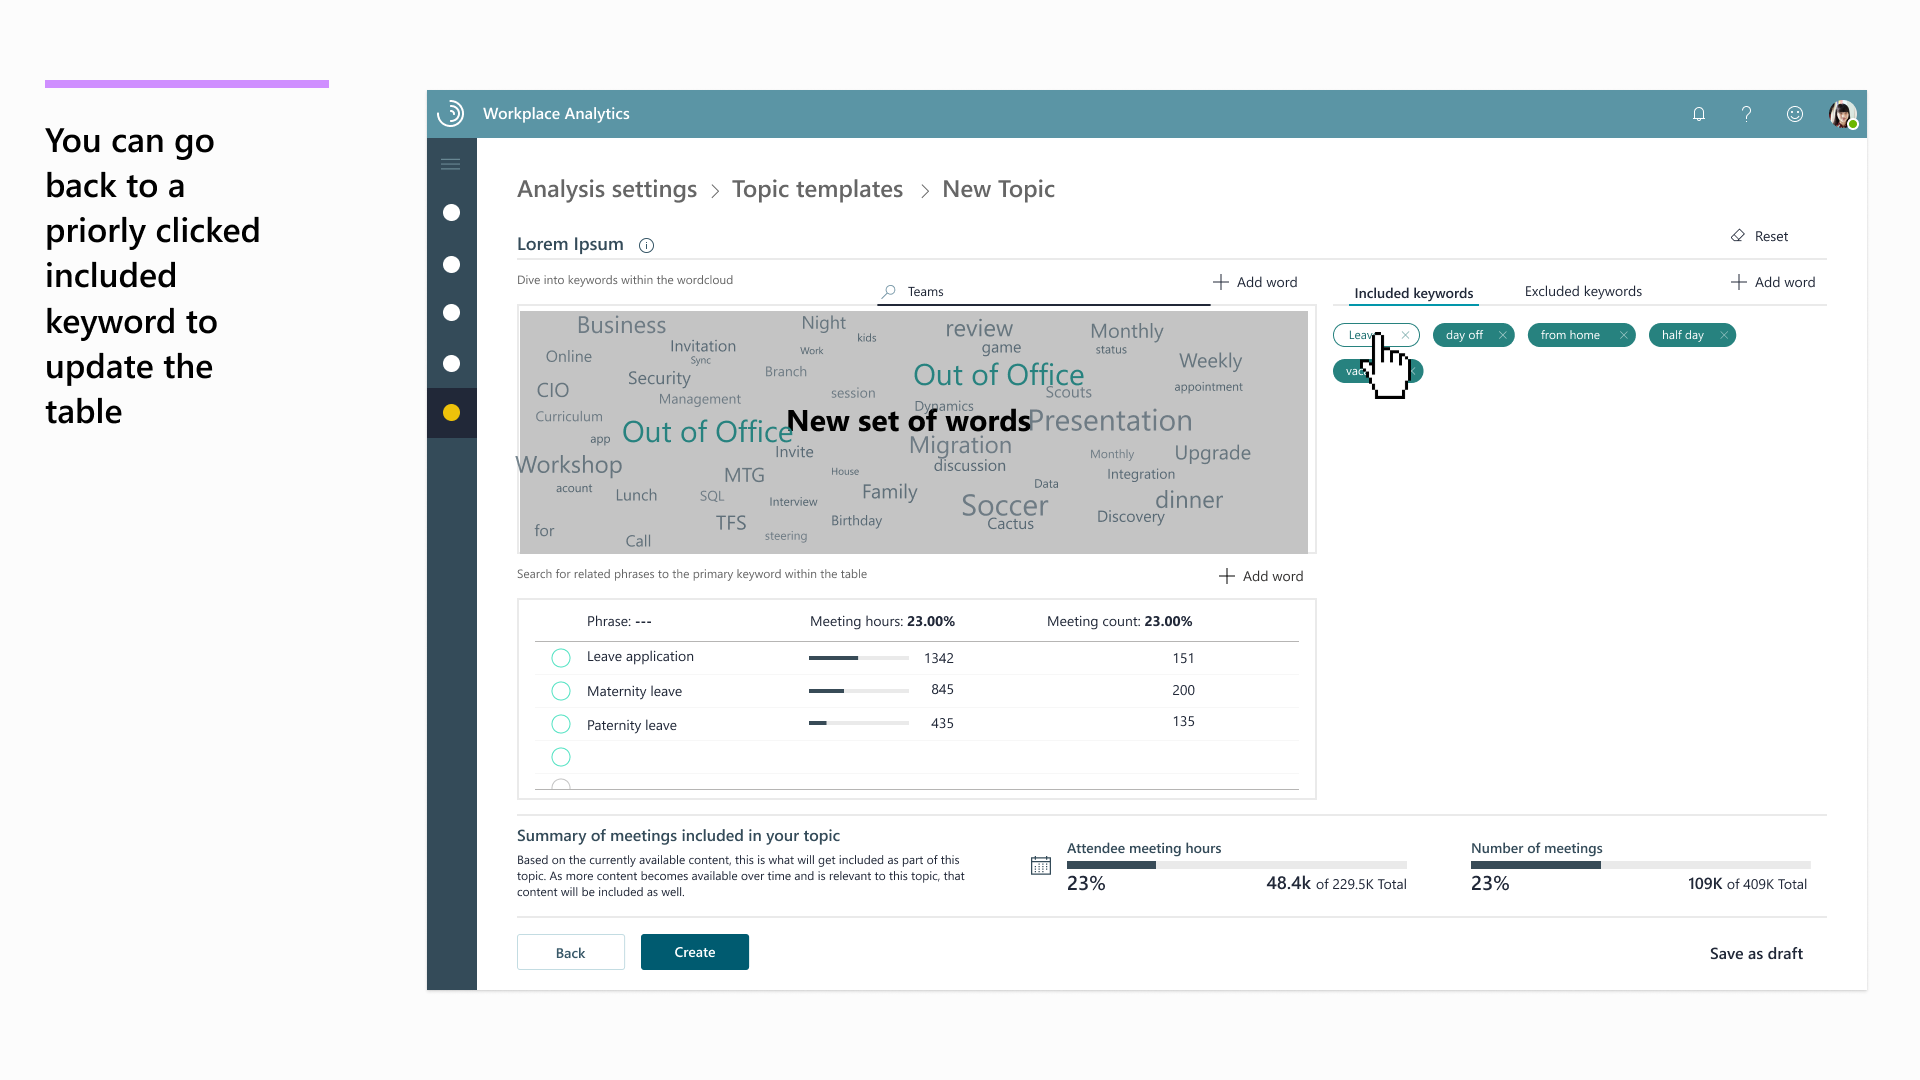
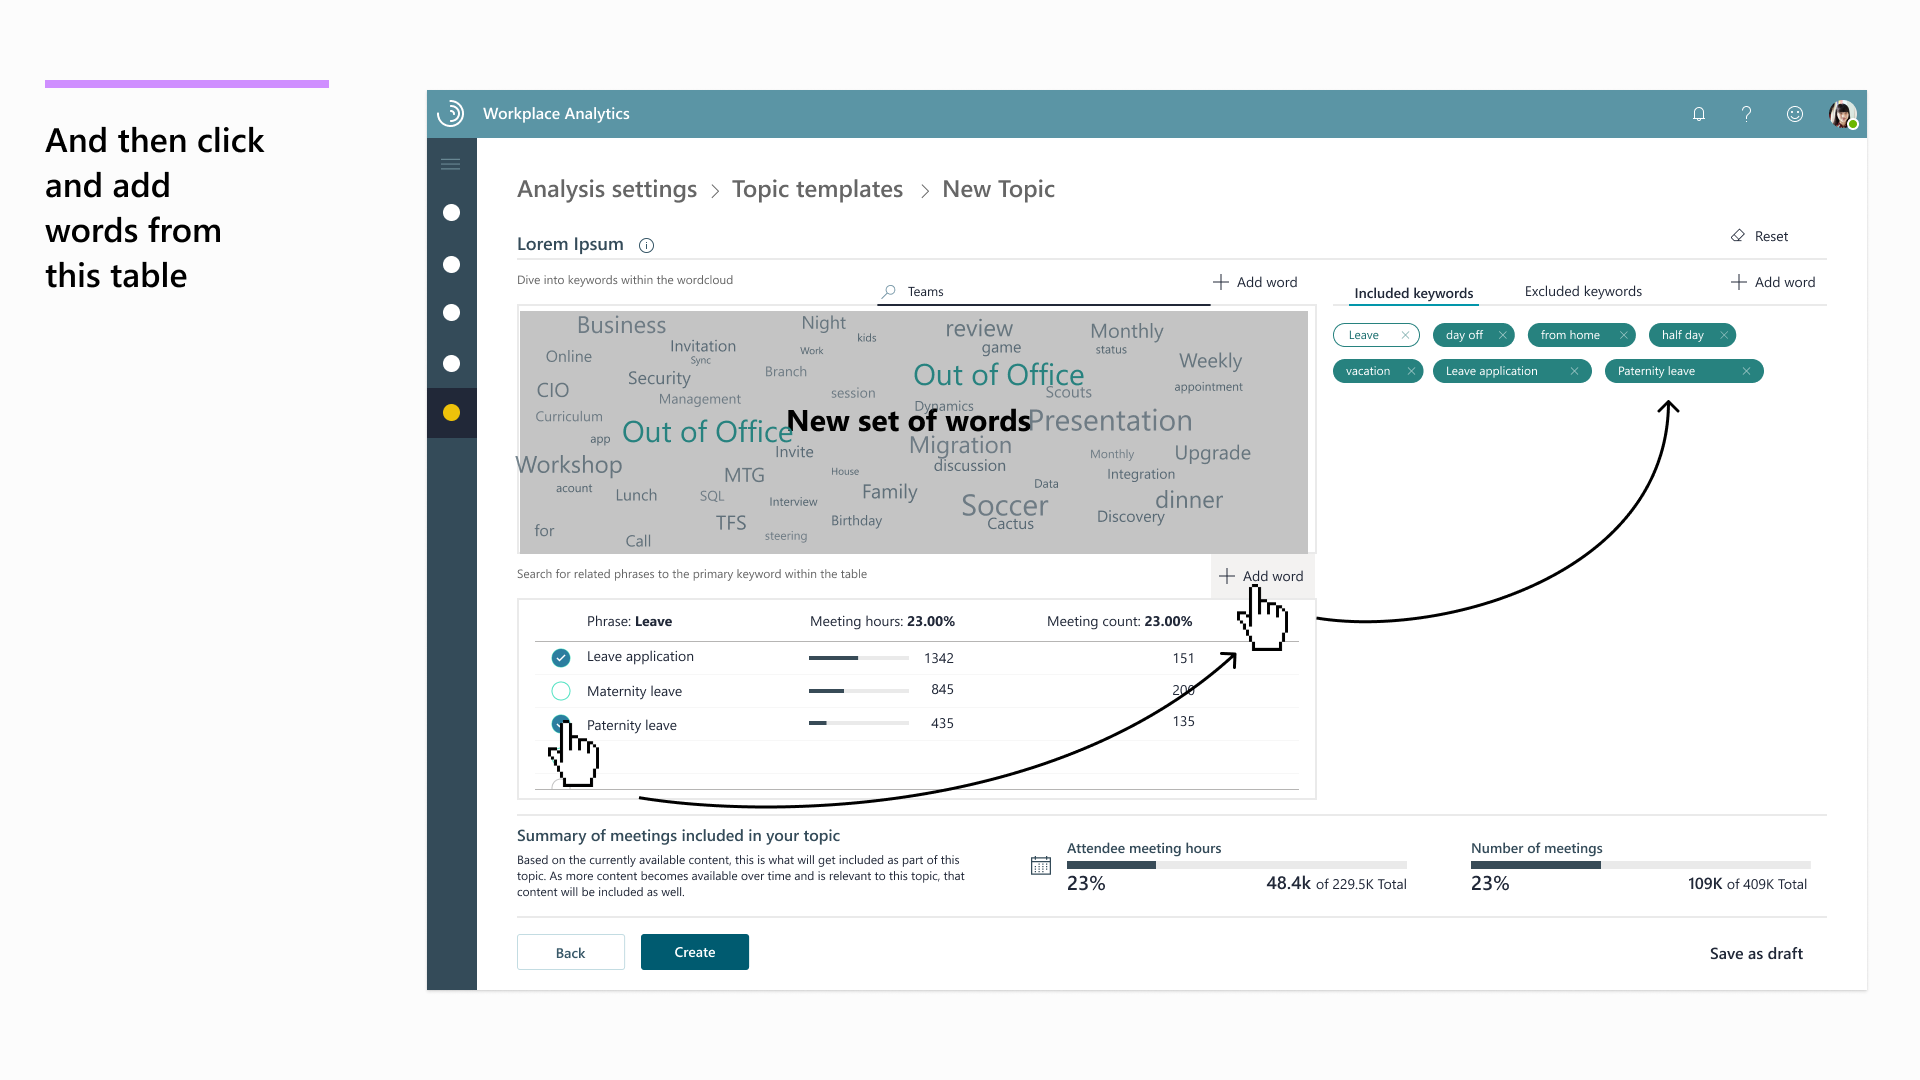
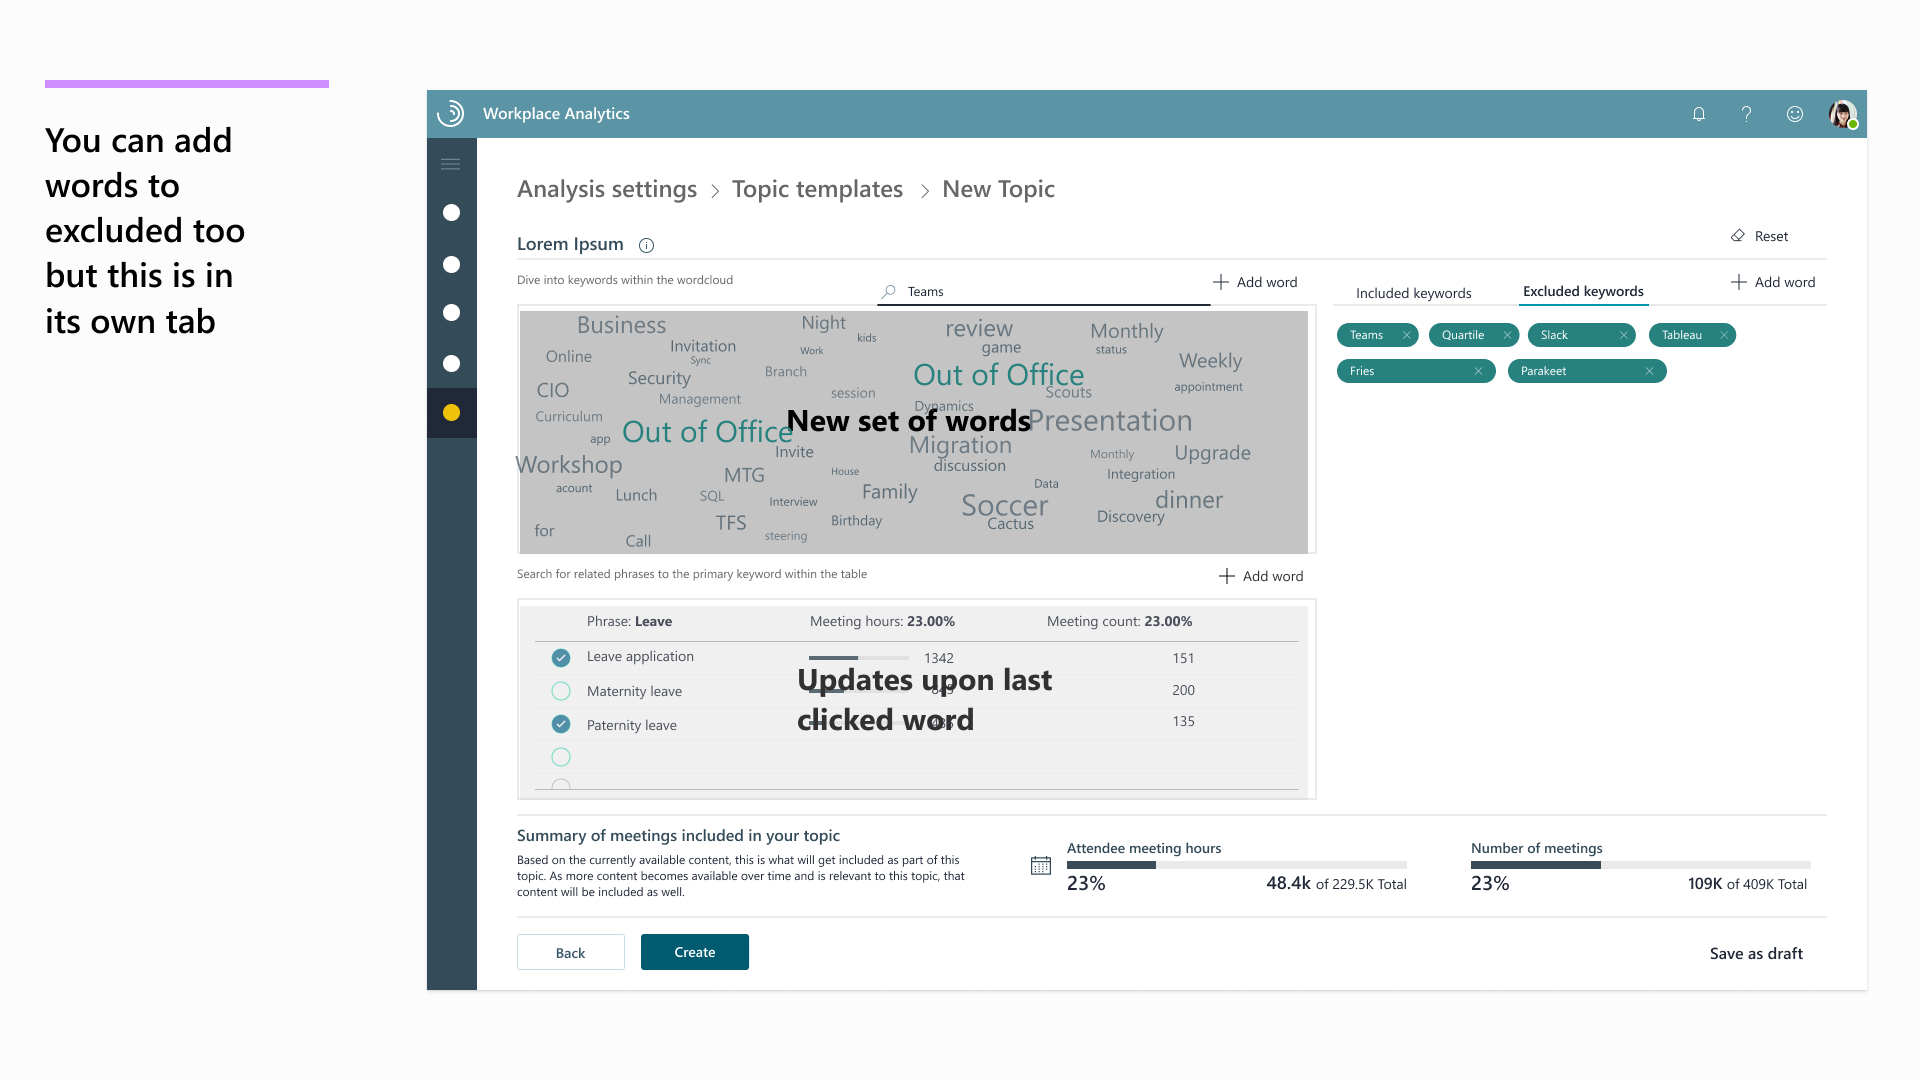
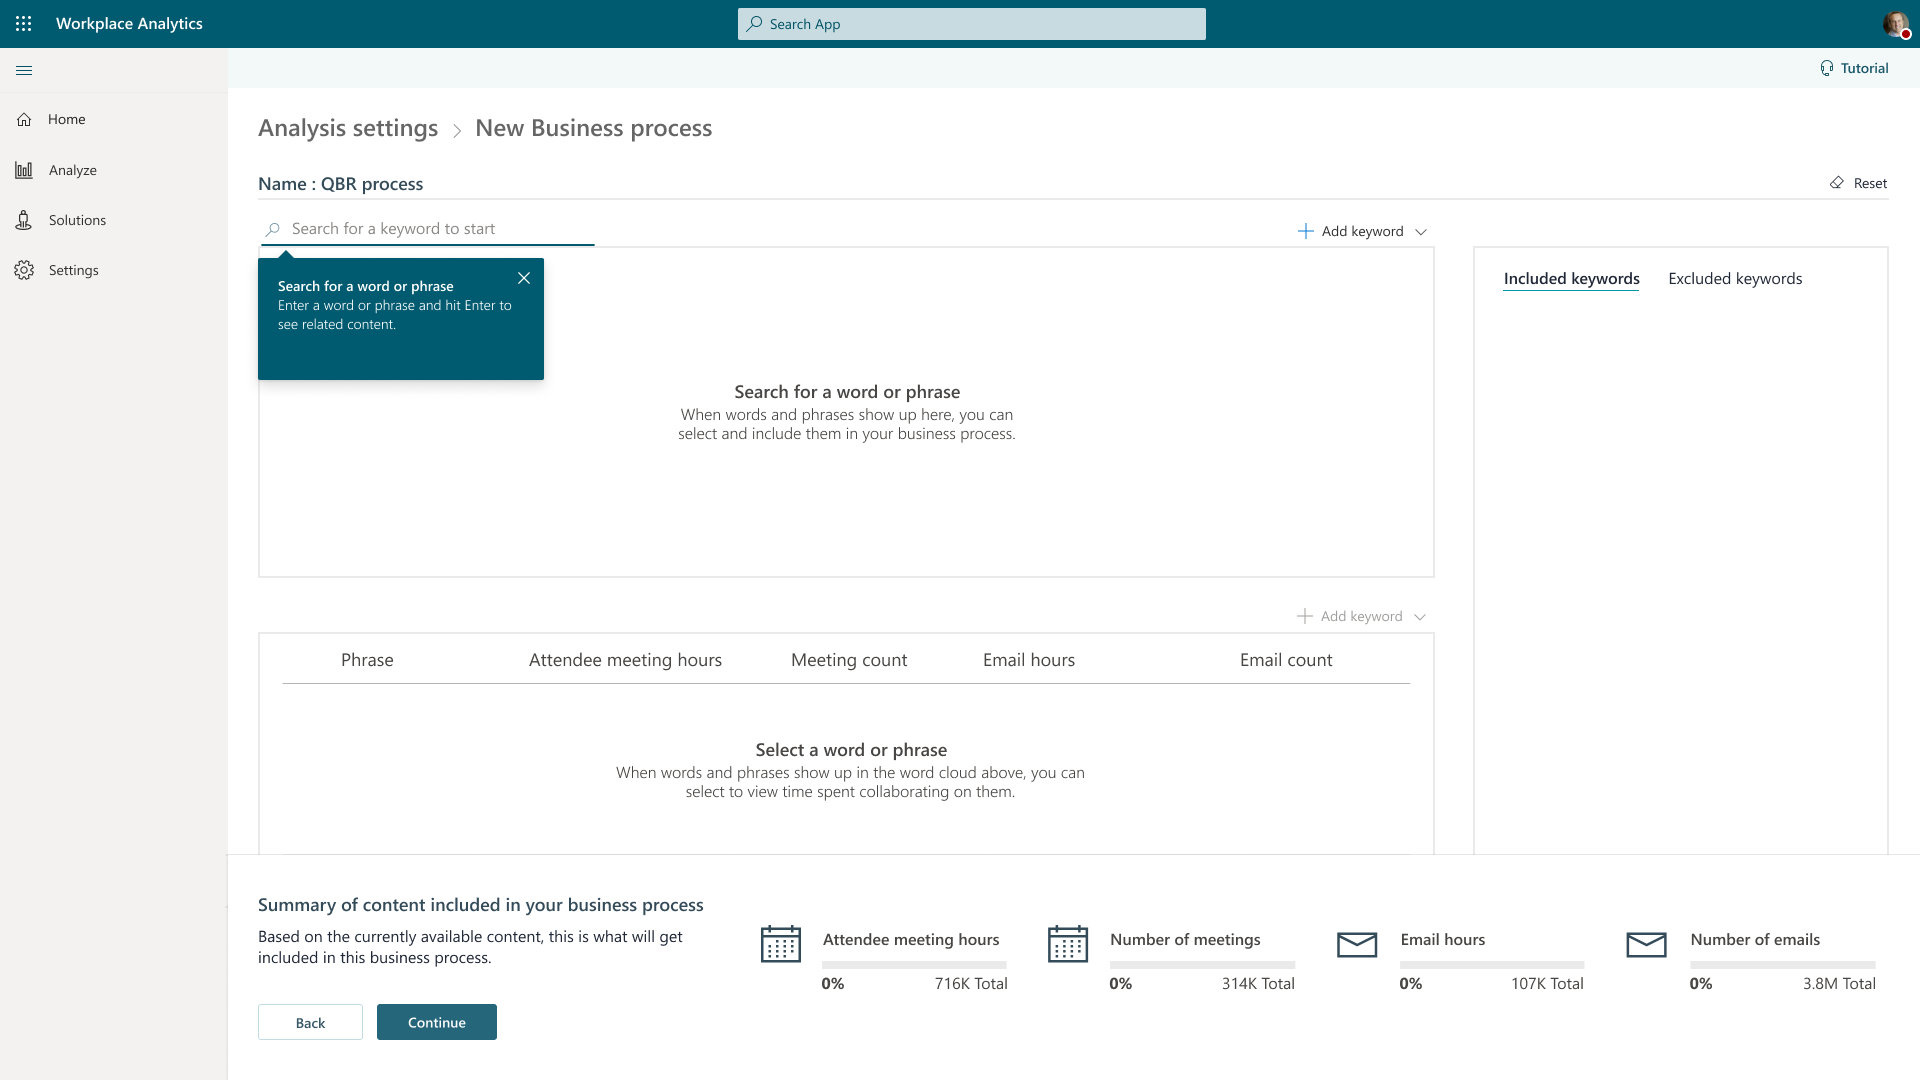
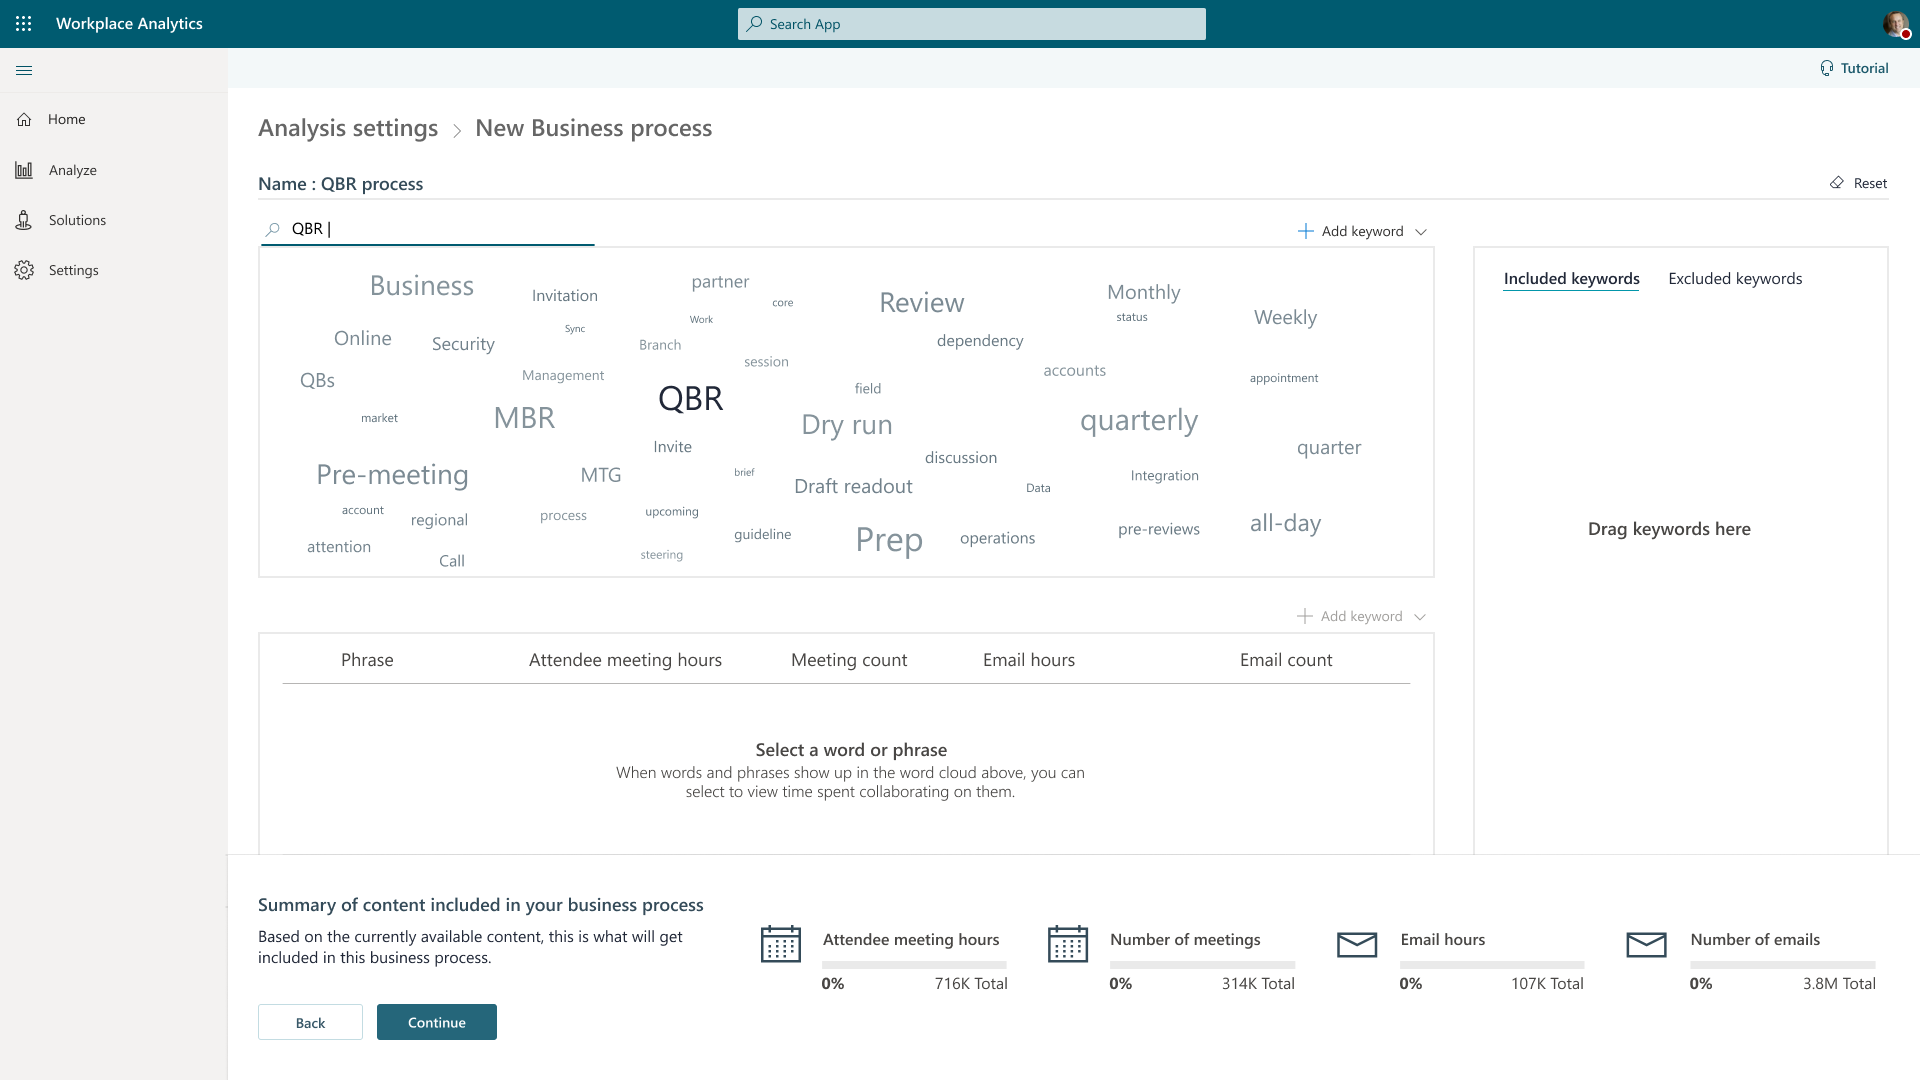
Final Flow and specifics for responsive layout
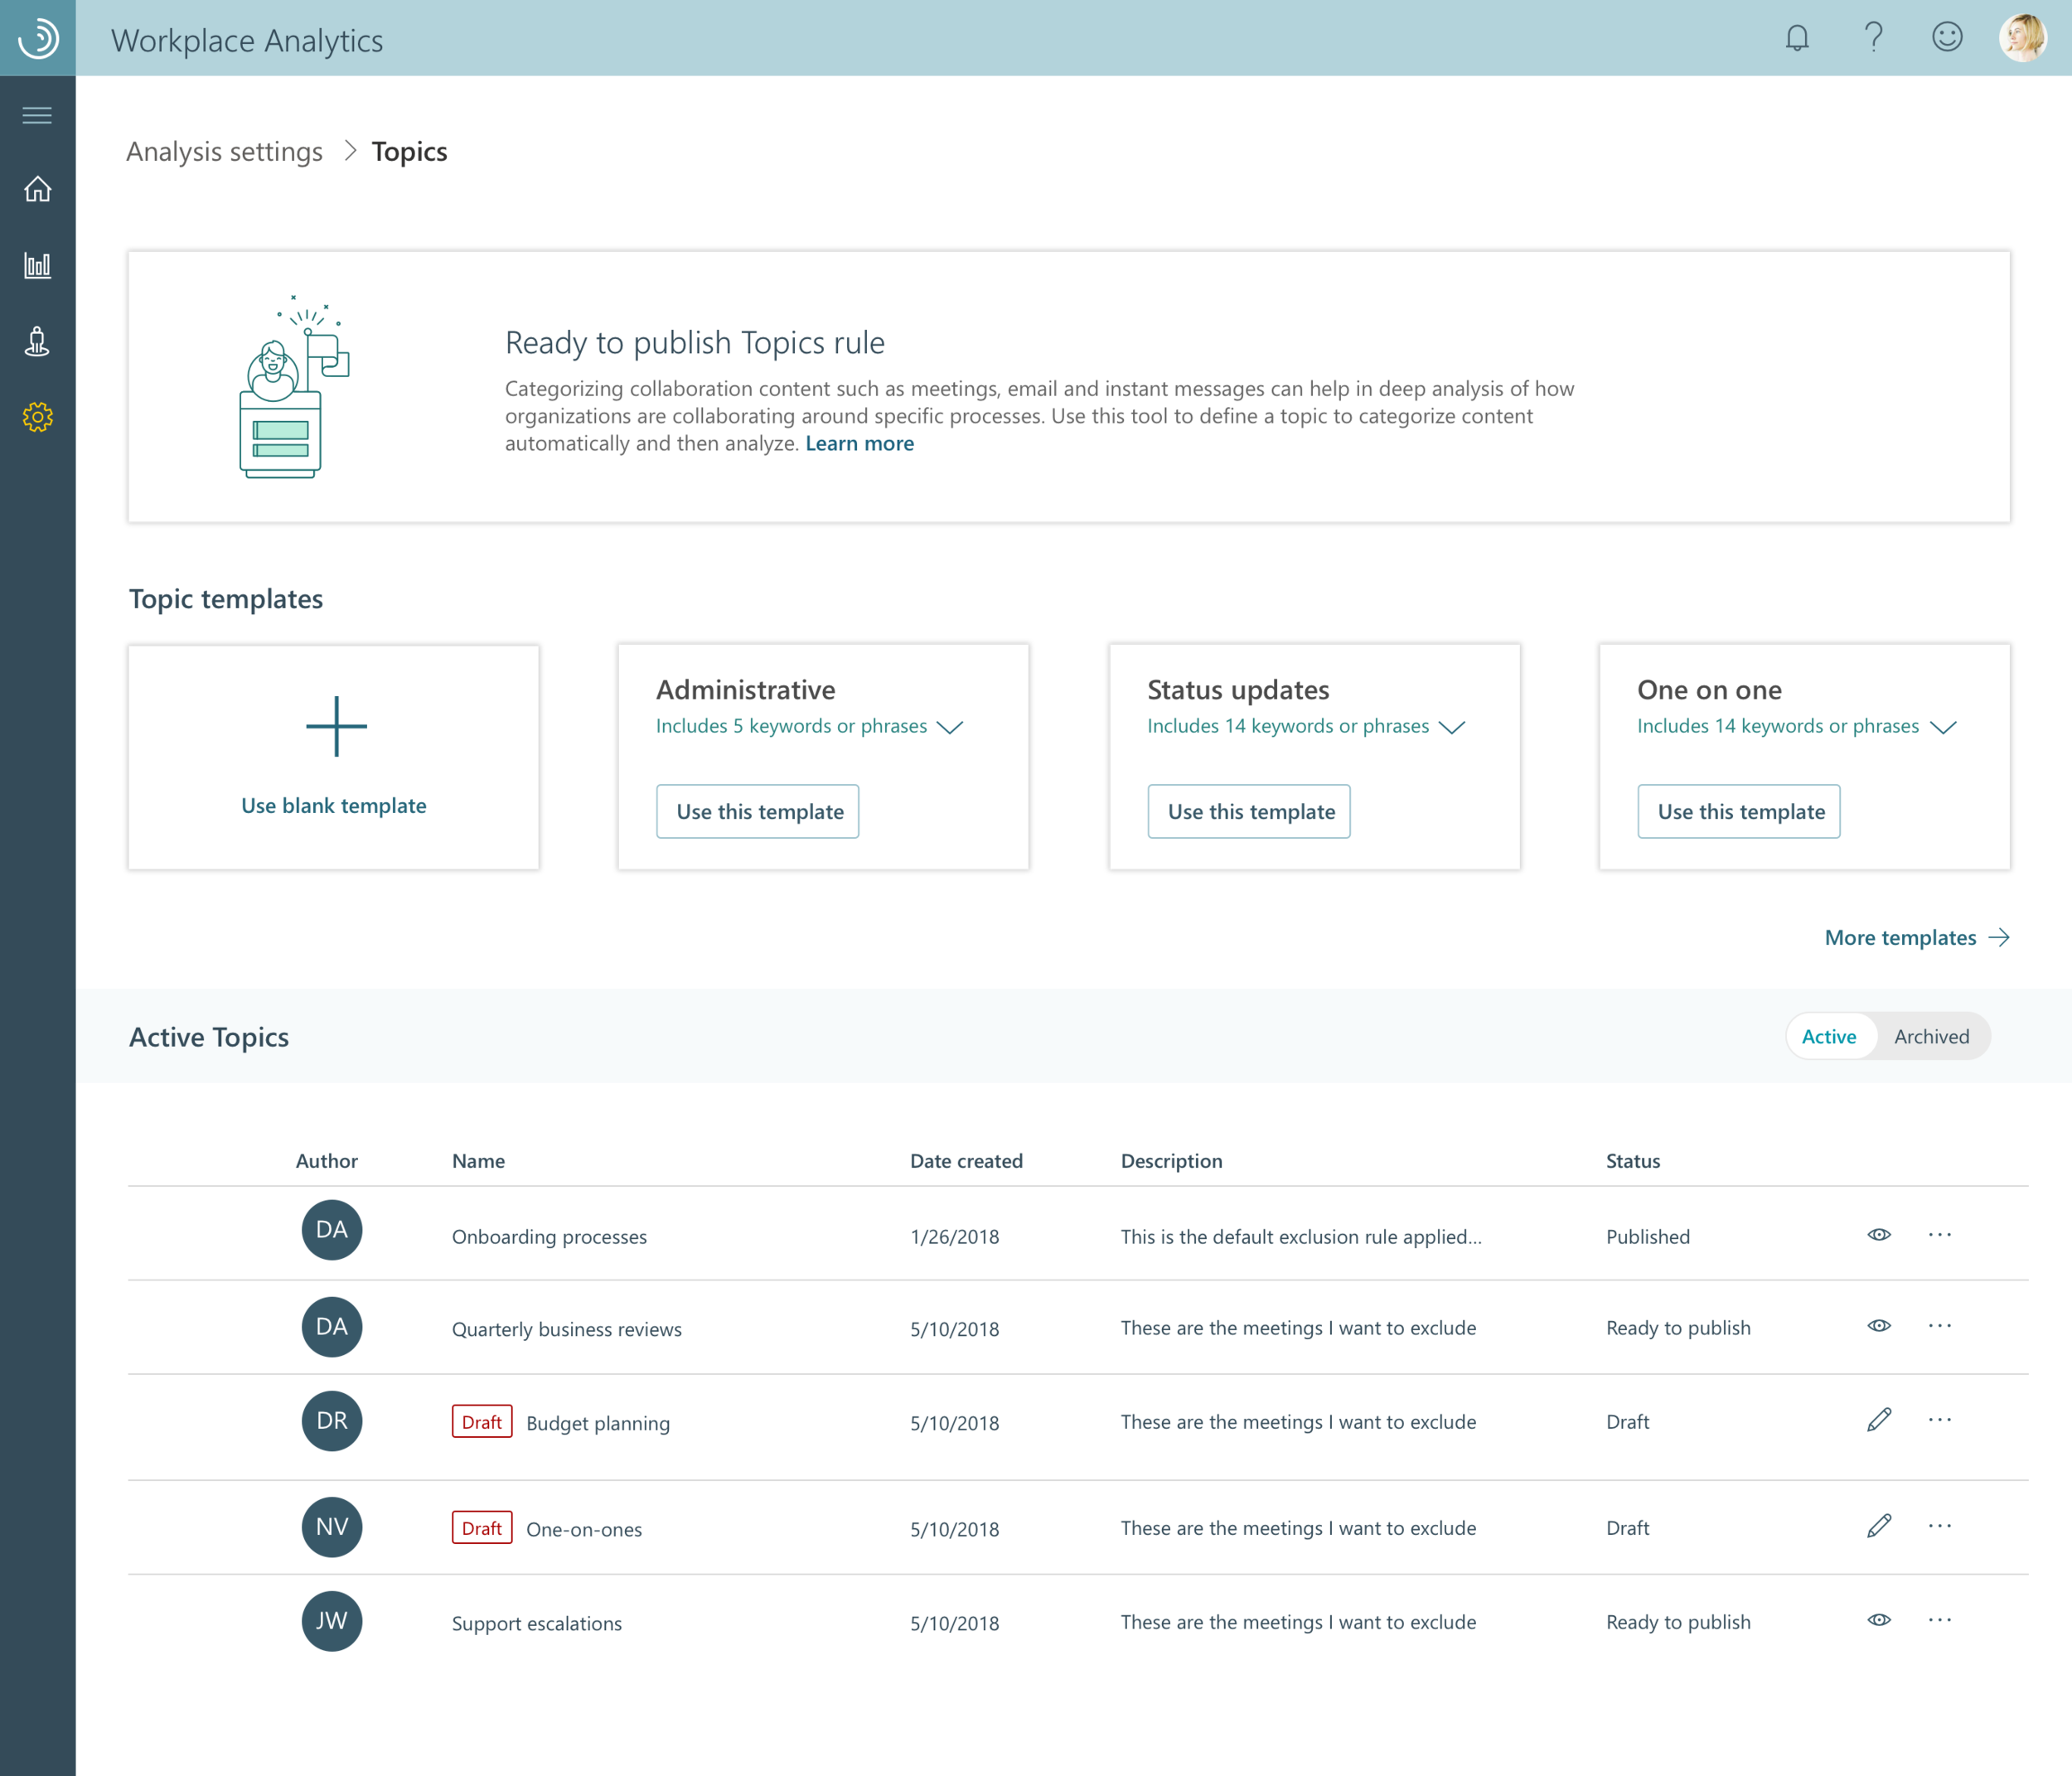
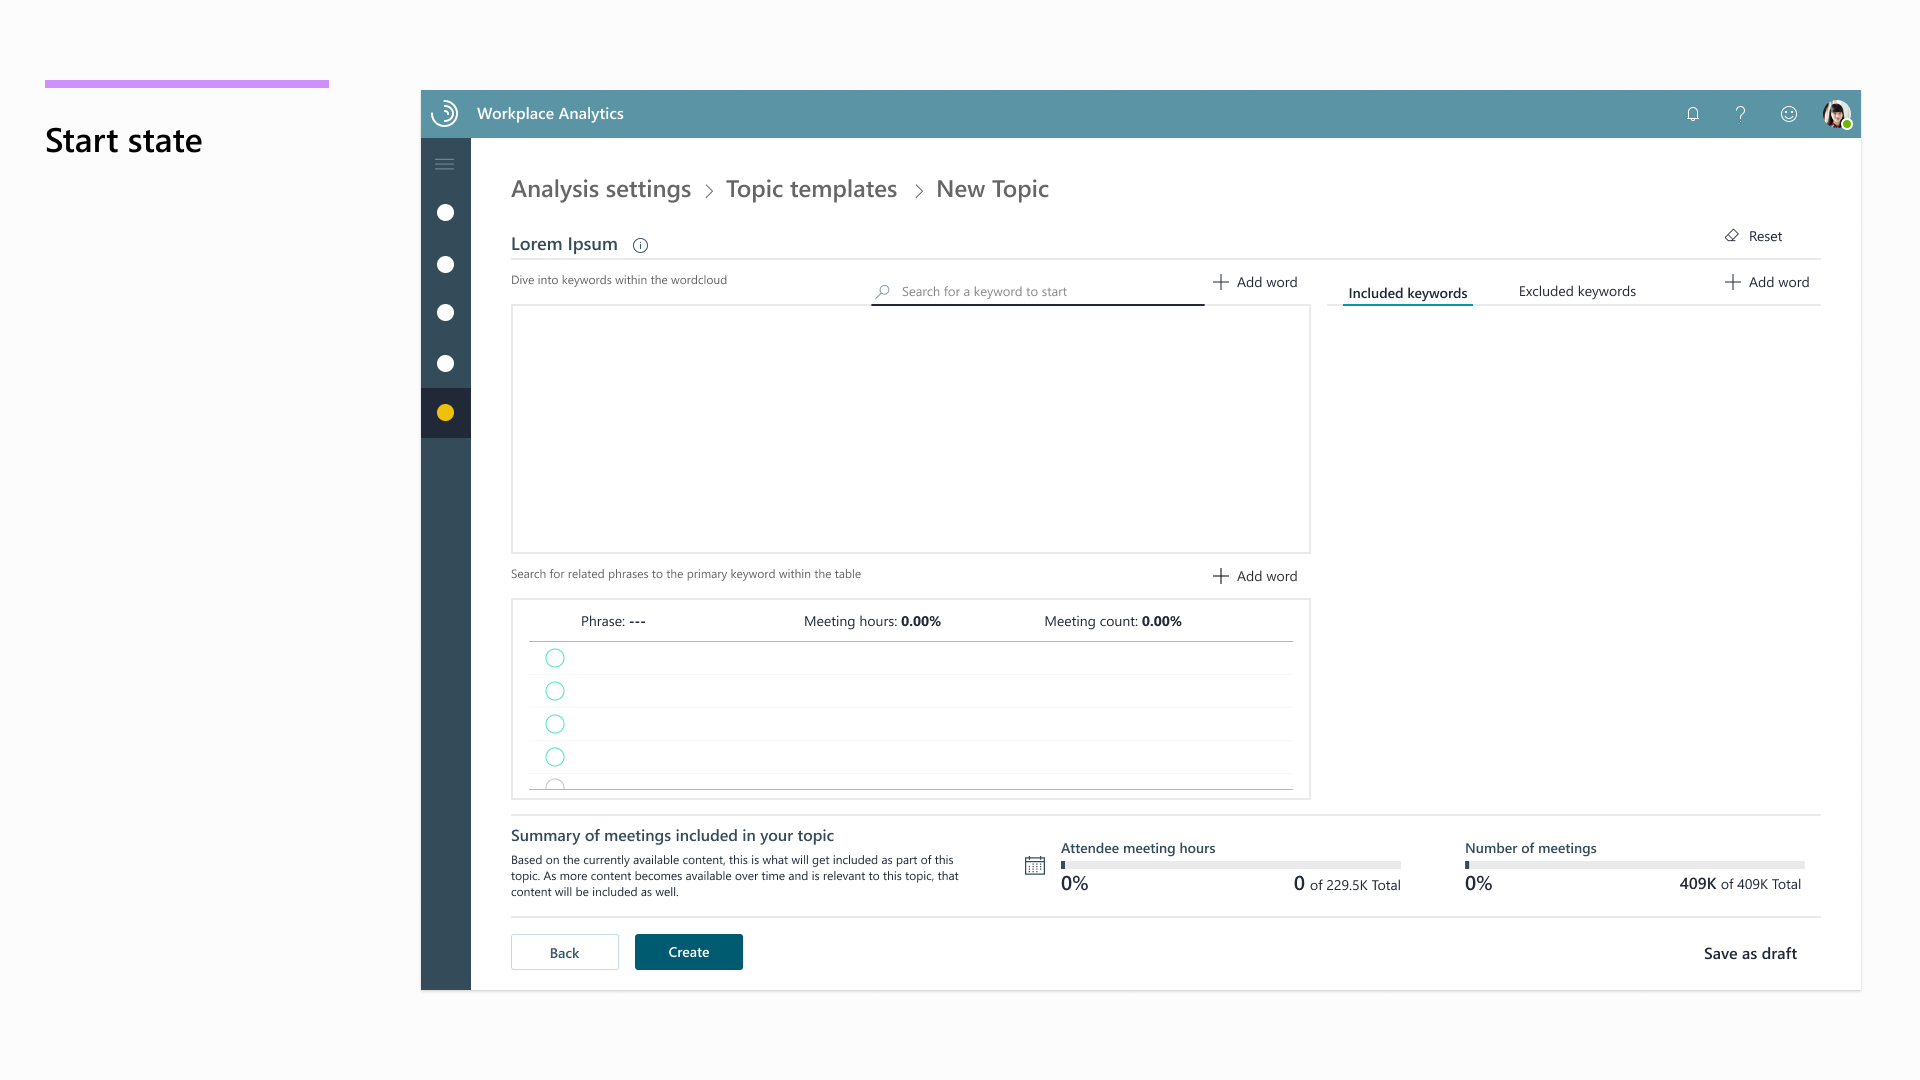
You can see the new final design (and general flow) below. Improvements over the old design include:
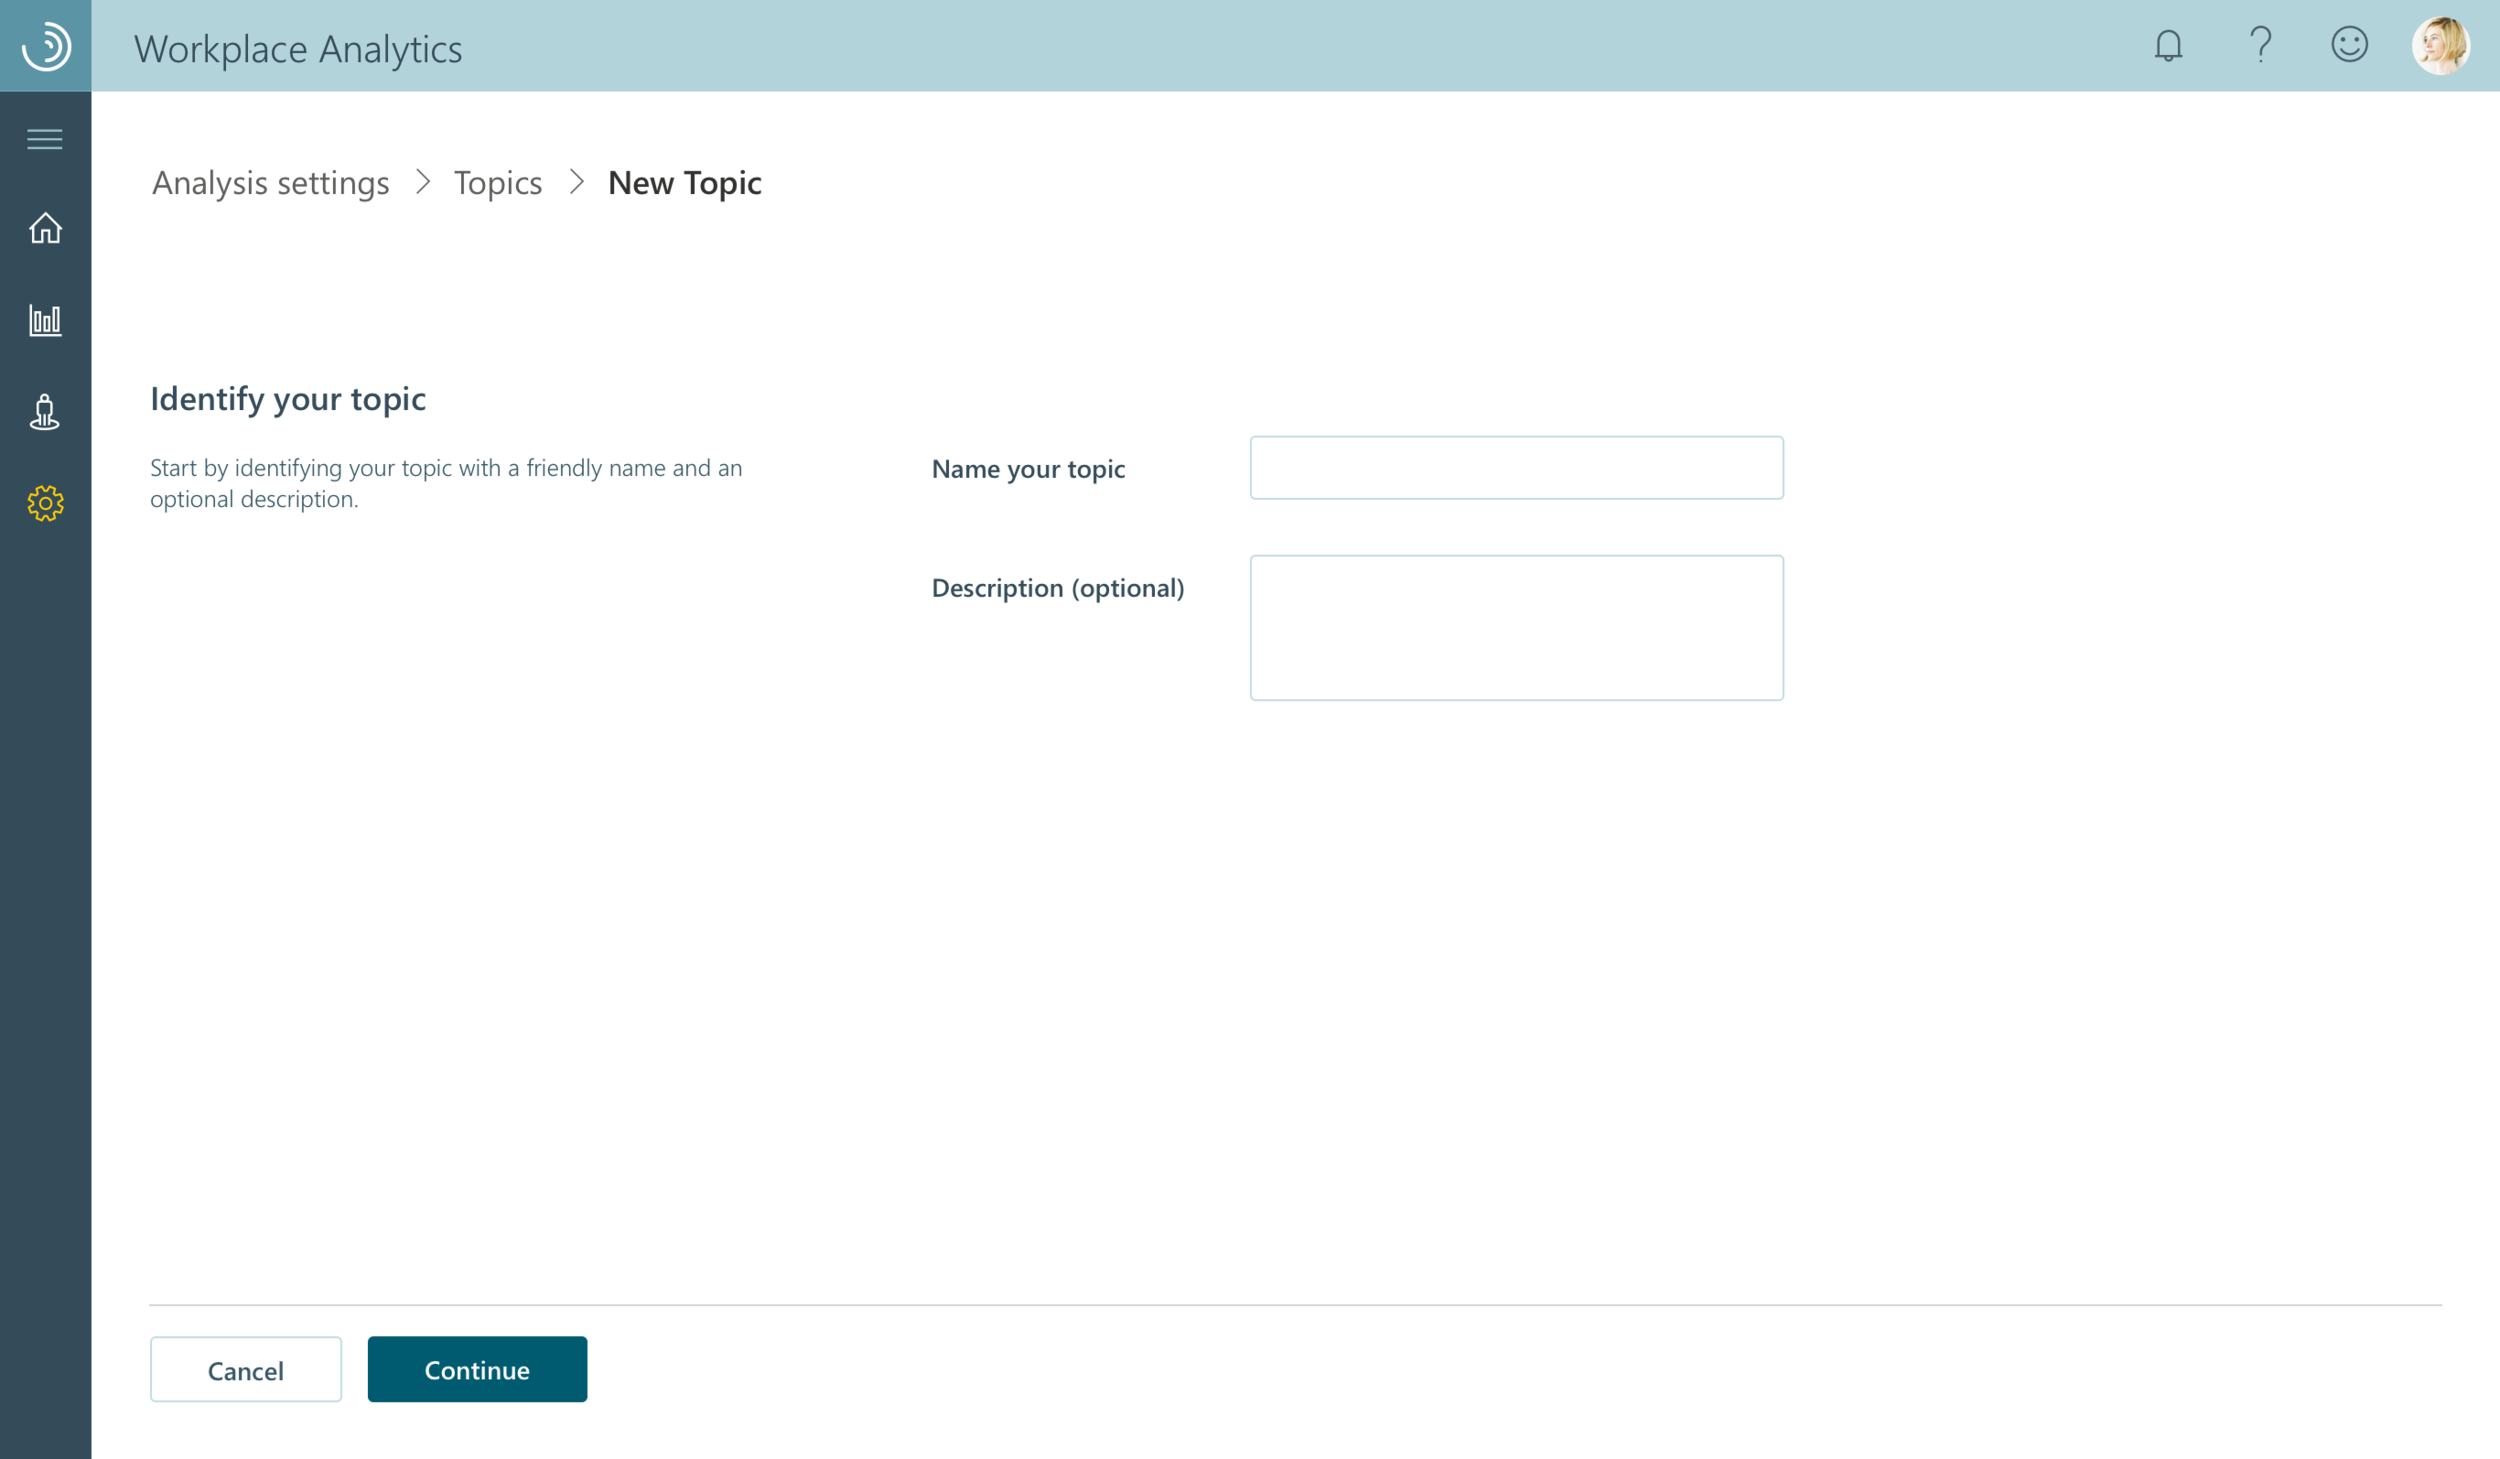
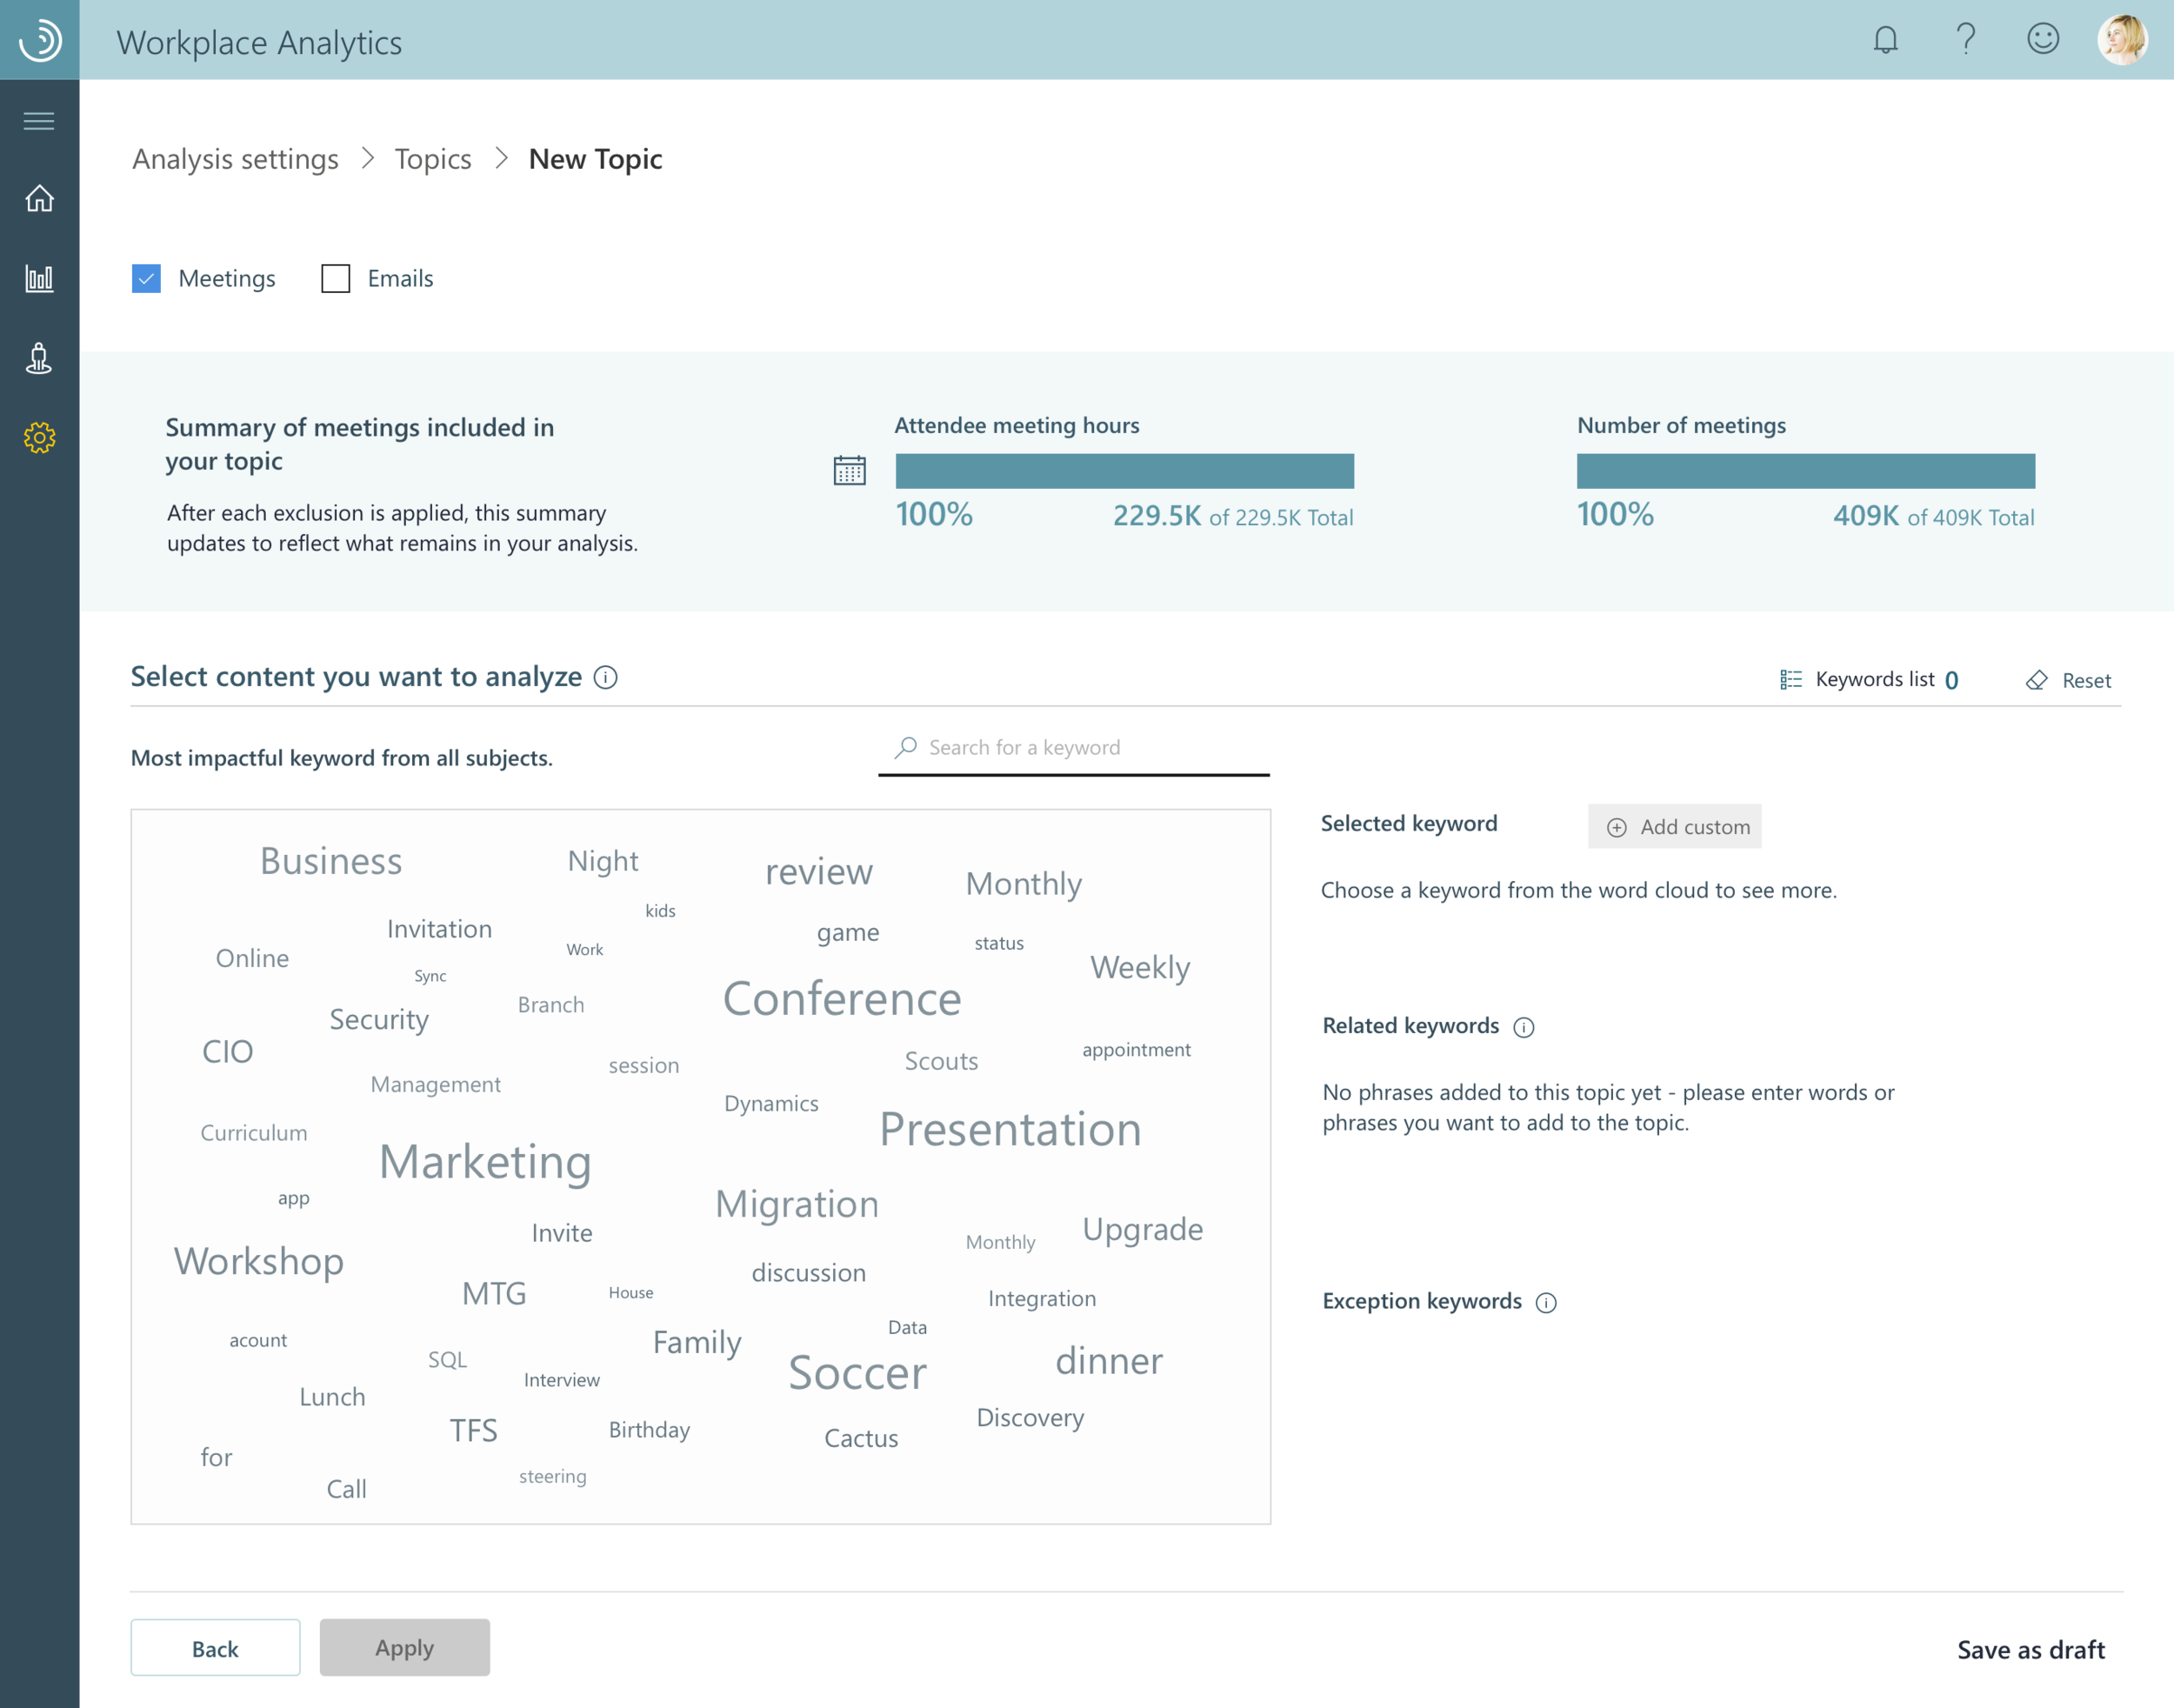
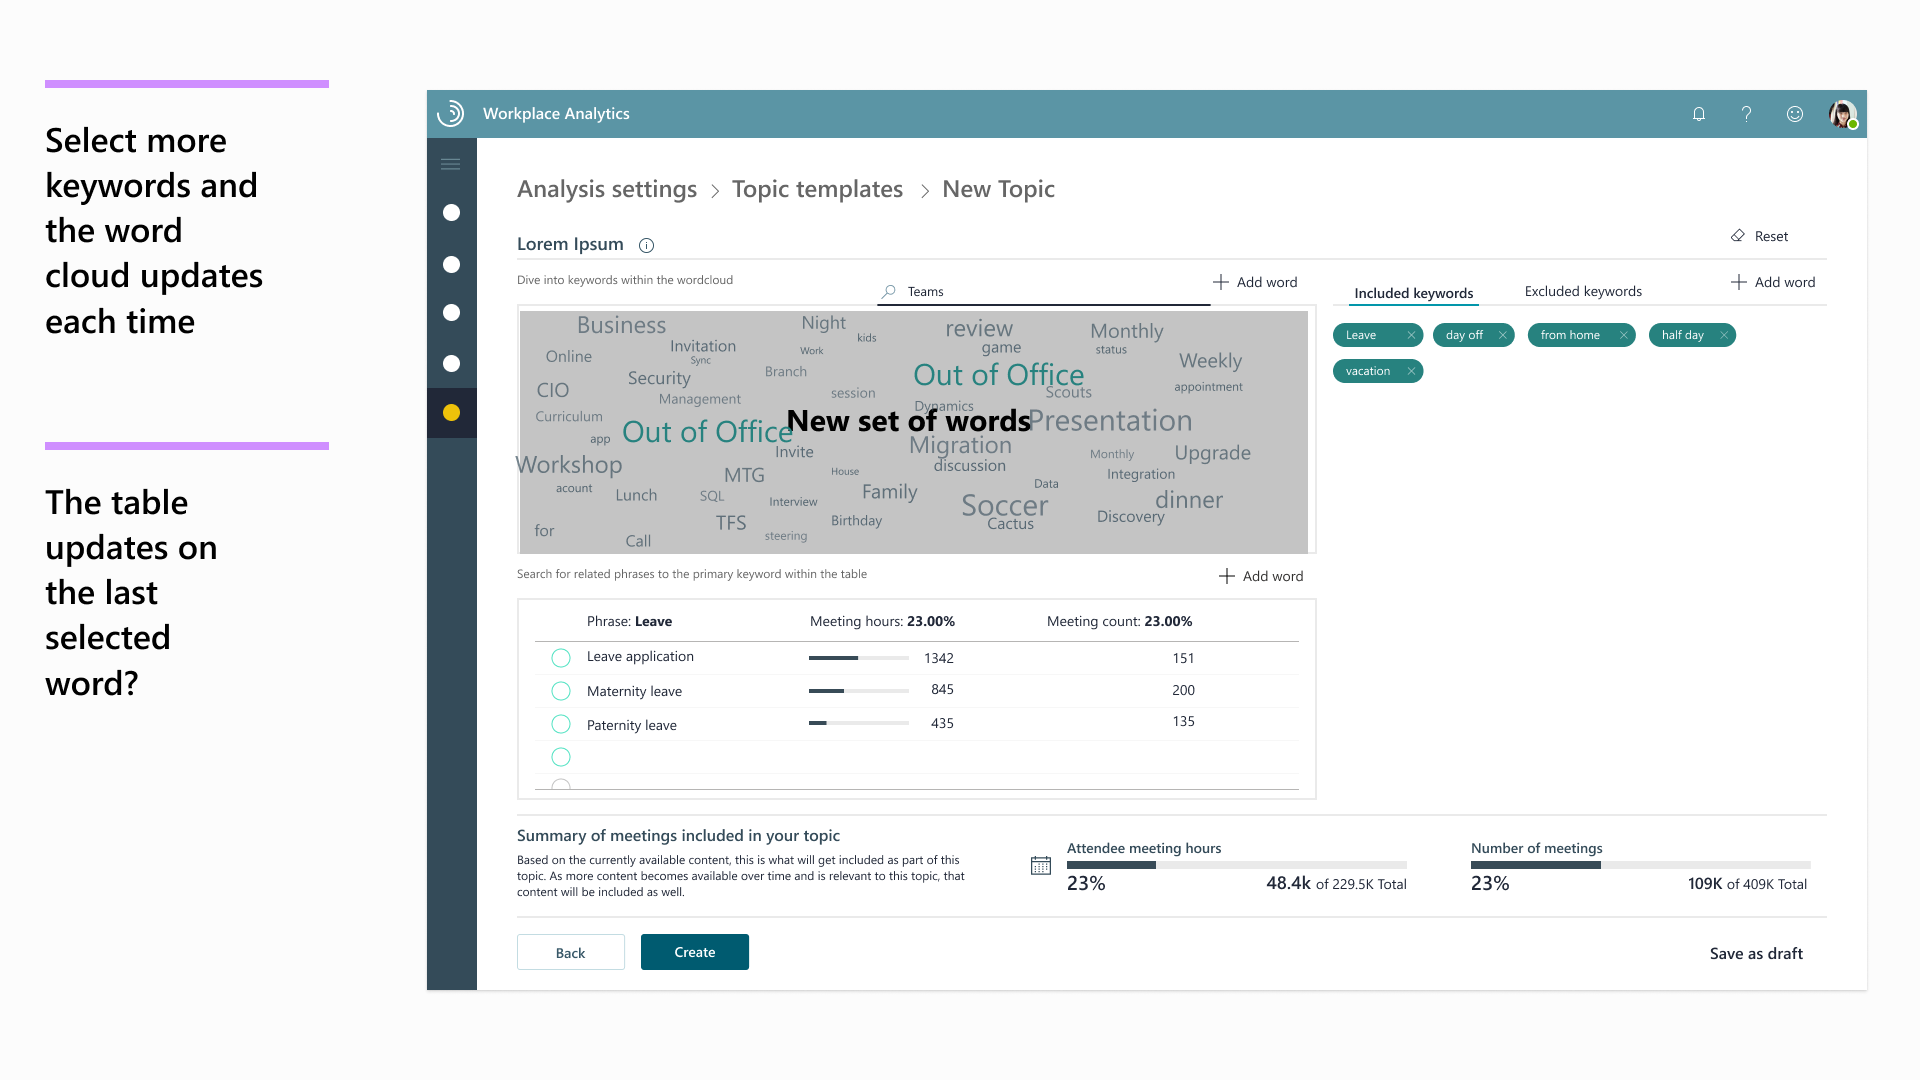
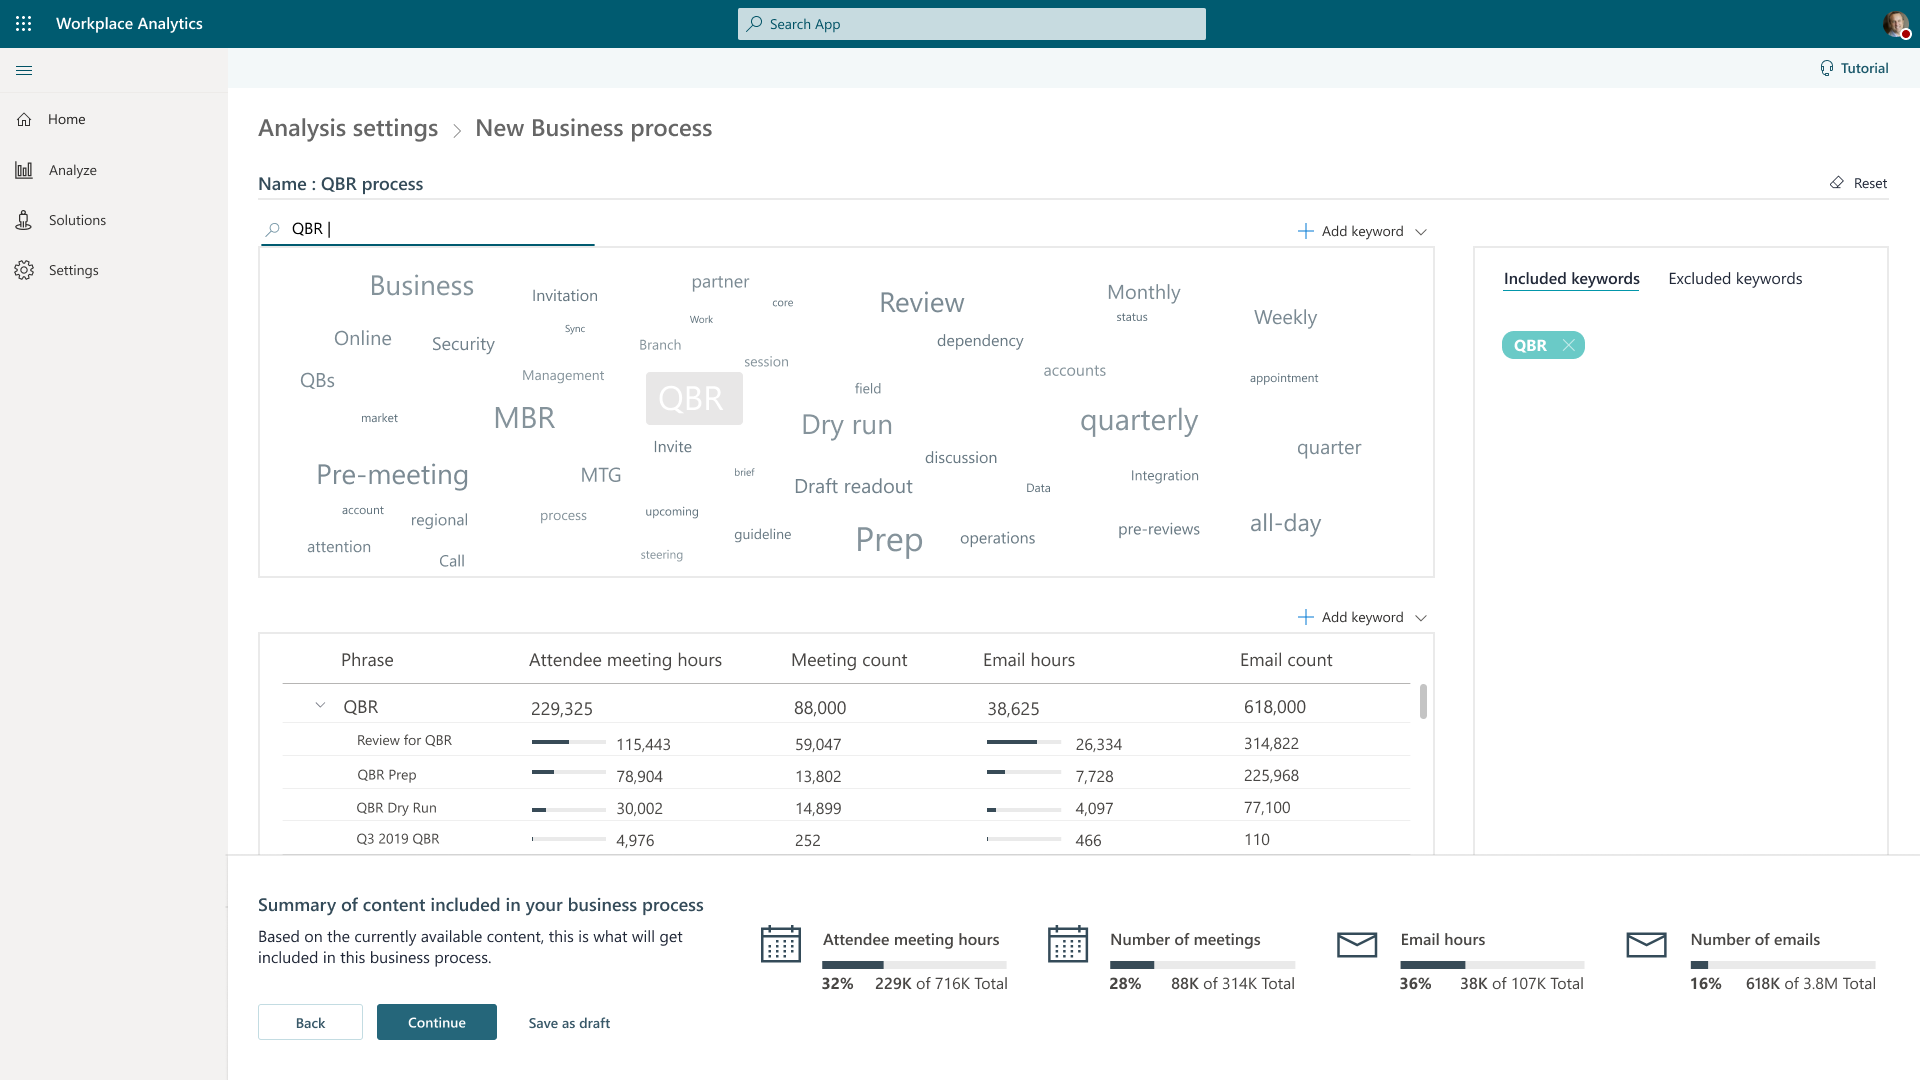
Consolidation of all steps into a single screen. Users no longer have to scroll back and forth to find their steps in the process.
Data viz became less superfluous and economical in its space usage.
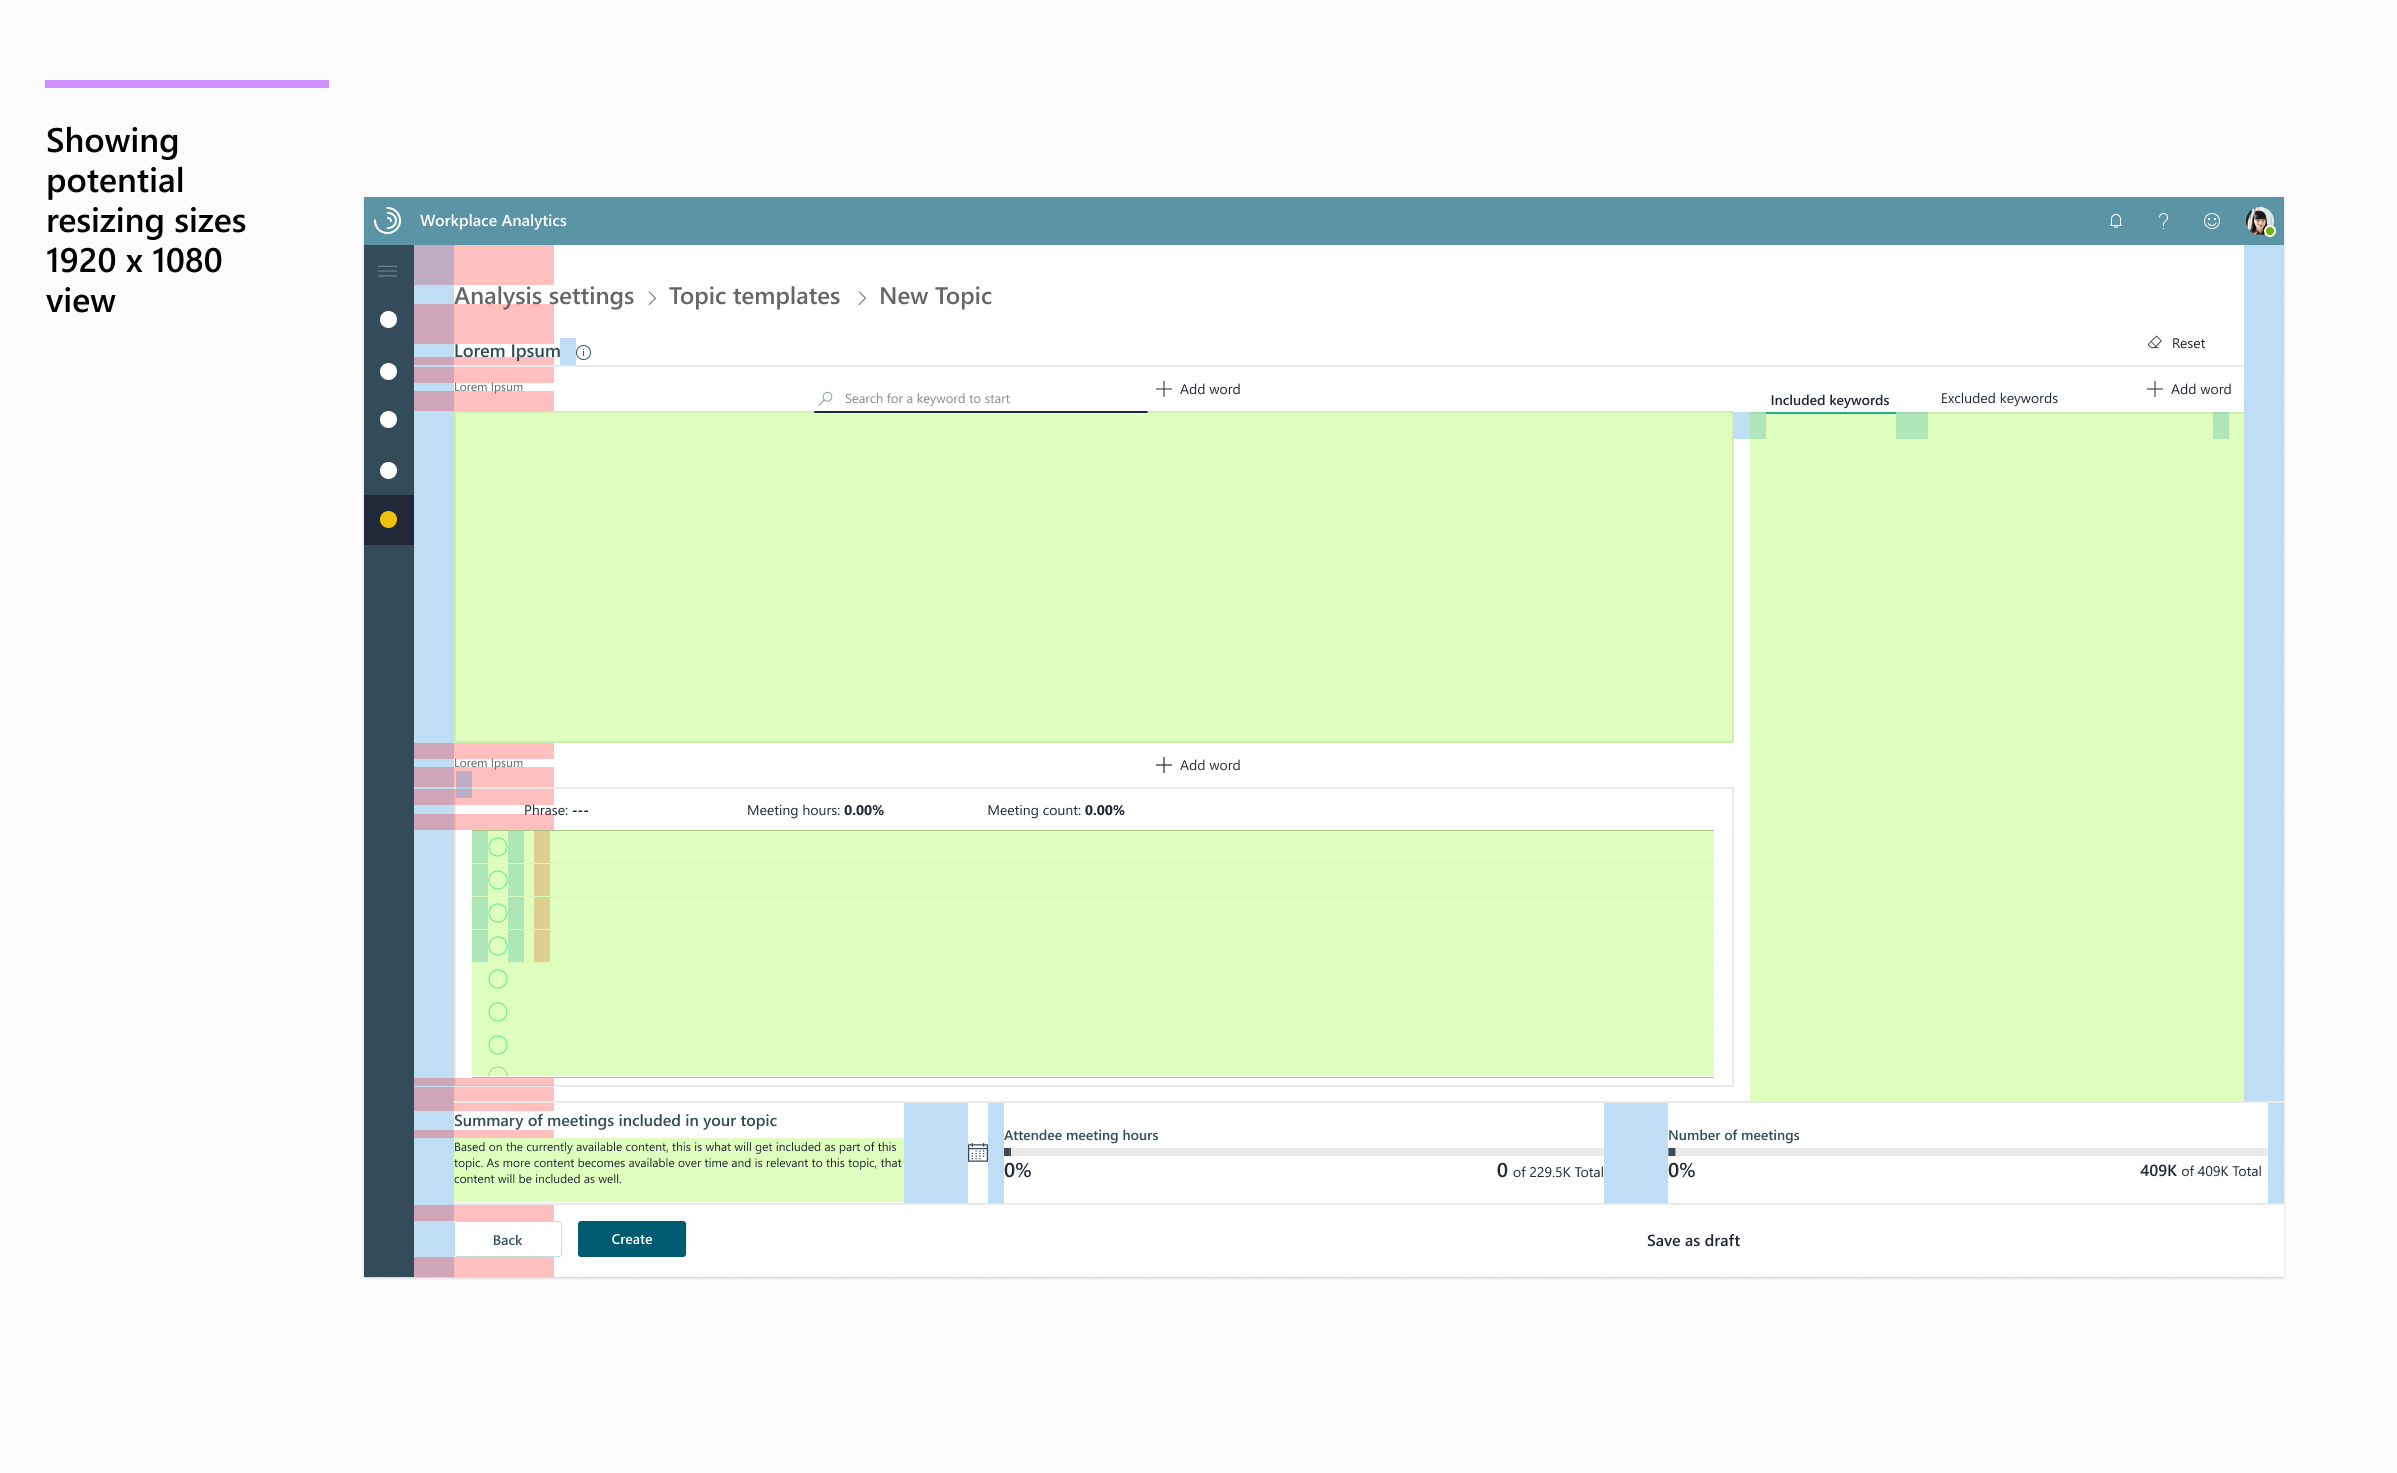
The new design took responsive concepts into understanding. While most of the screens I’m showing are for one of the lowest resolutions we expected to see, examples were shown of how each section in this process could expand, based on desired usage in a larger screen.
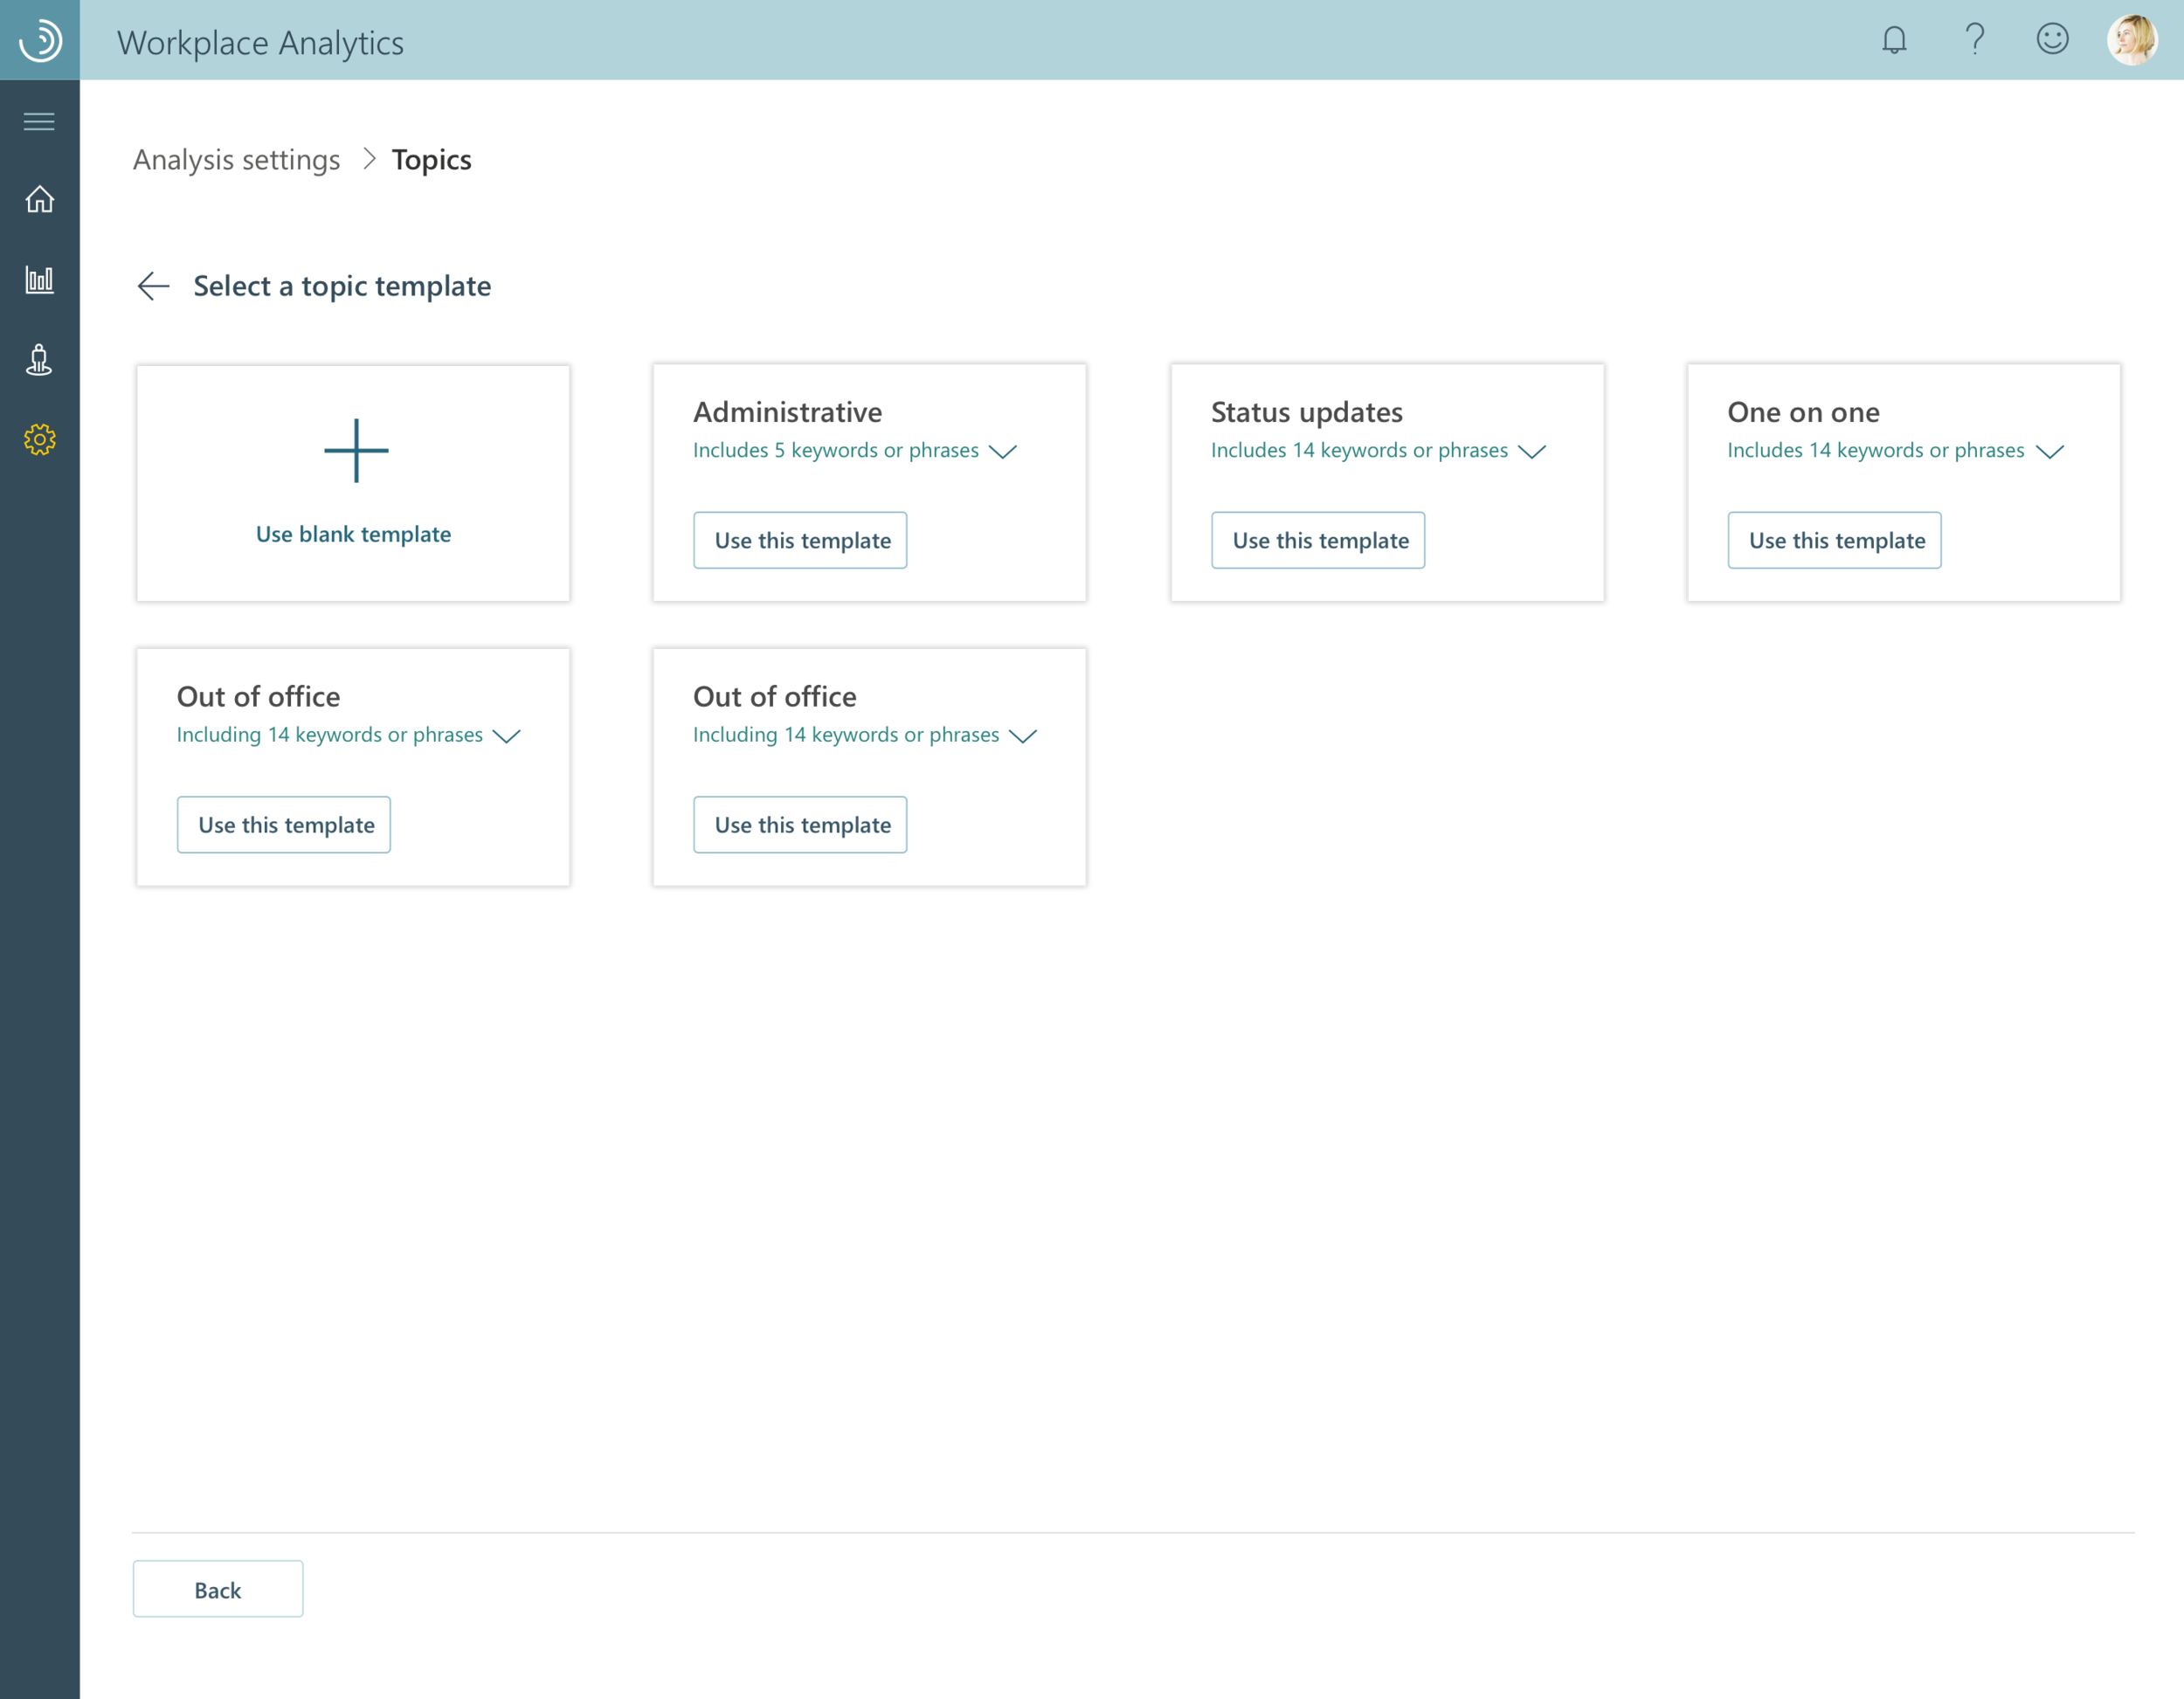
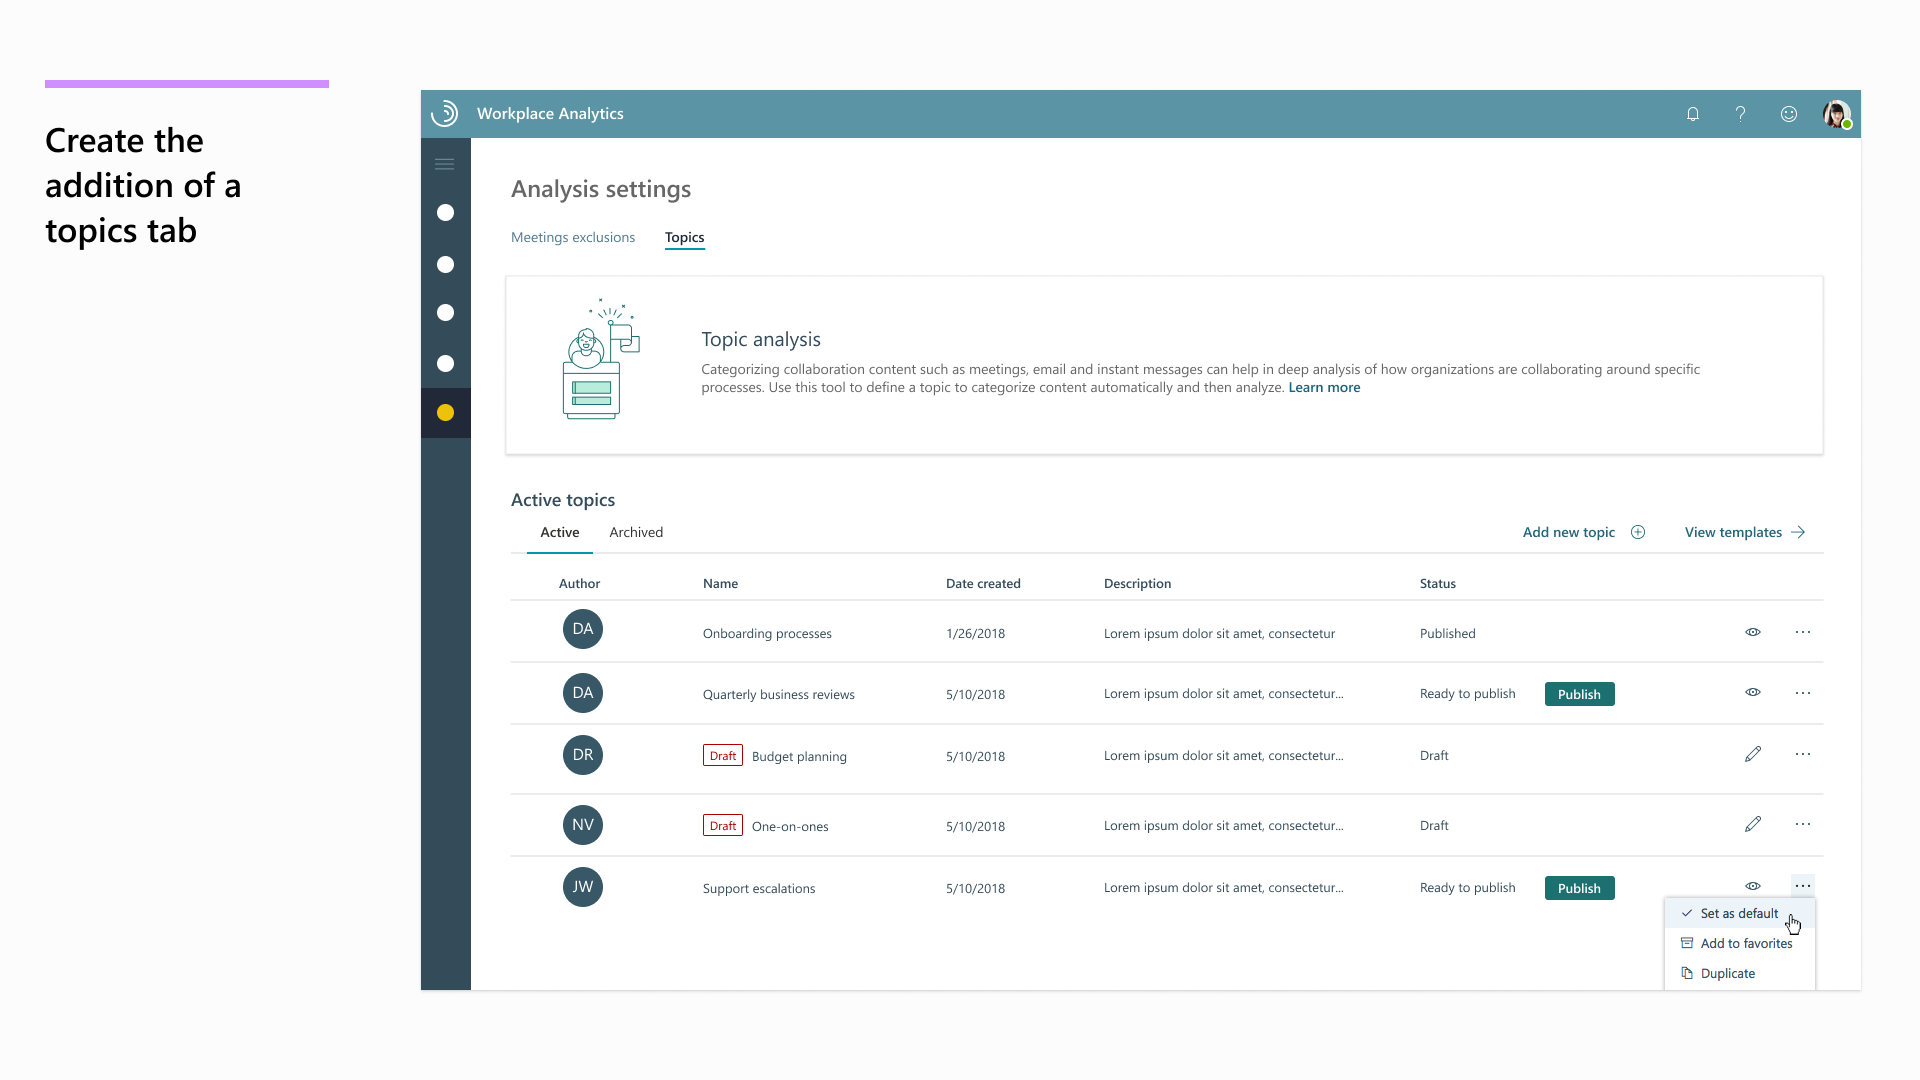
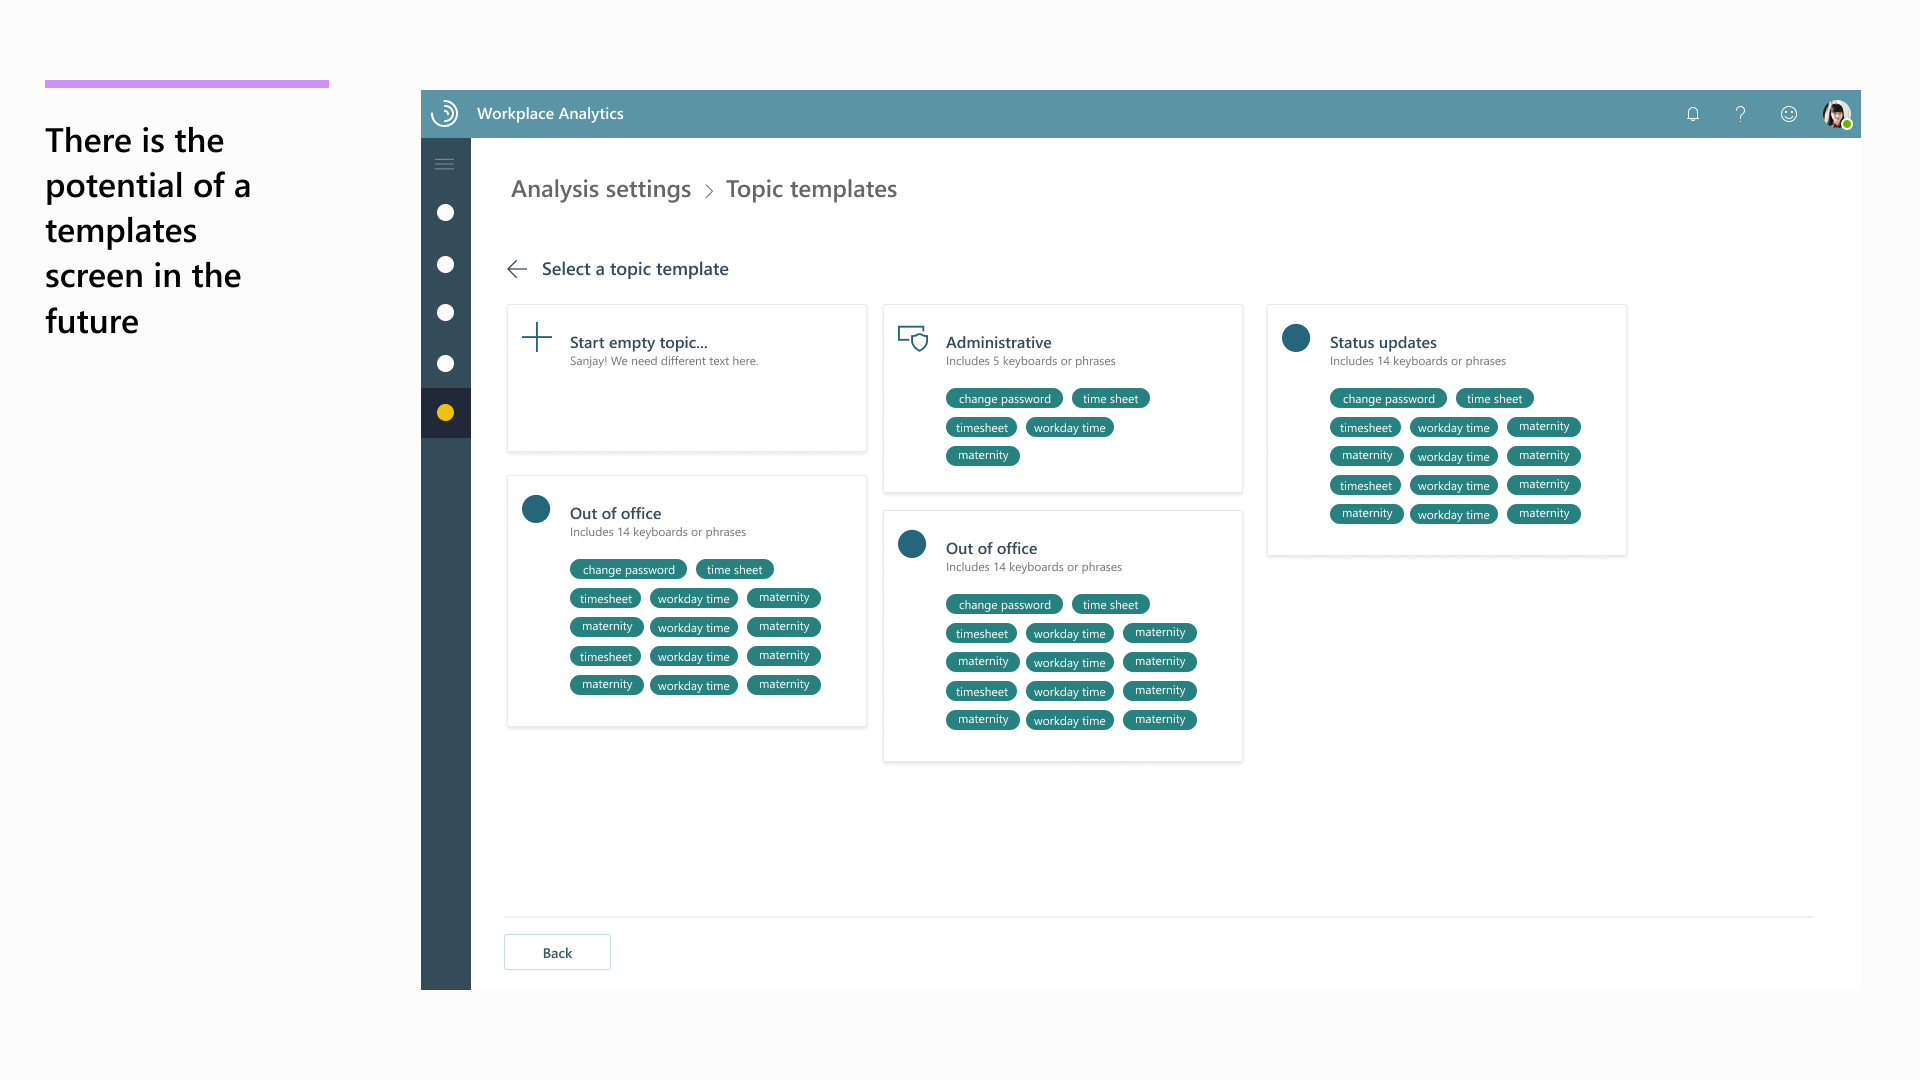
Small thing but the template selection screen was changed to look similar to the patterns used elsewhere in the application, improving cohesiveness and reuse of components.

And then mild visual redesign and integration into larger design framework
At the end of this project I’d left Workplace Analytics to join the Teams org. But other designers on Workplace took my overall layout/interaction work and integrated it into the design system I’d laid out during the time working as the primary FTE in the group.
Success in Design
I consider this one of the more successful projects from this team. We were able to do a fair amount of testing with users of the product to confirm where key issues existed and focused on usability, not just integration of features.
The aesthetic look and feel was updated too, based around design work I’d done elsewhere, and overall I moved the app to look more cohesive with other Microsoft applications.